
| Area | Basin-wide/Regional |
| Topic | Temperature: MWATs of Mainstem Mattole River (Fahrenheit) |
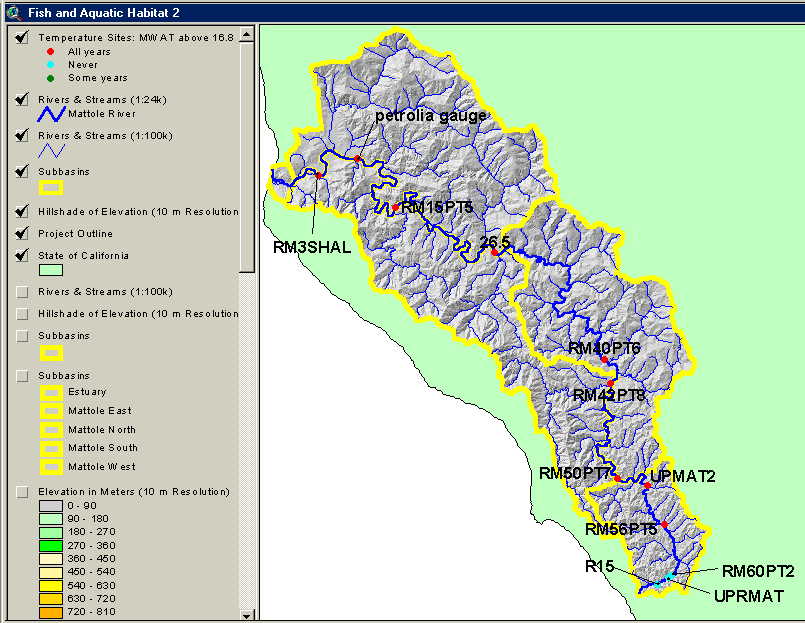
This image from the KRIS Mattole Map Project in Arcview shows the location of temperature monitoring sites in the Mainstem Mattole River. Sites where maximum floating weekly temperature exceeded 16.8 degrees C in all recorded years appear as red dots. Site labels come from the ORIG_ID column of the chart table and correspond to data originator as follows (press F7 for best view):
ORIG_ID CONTRIB
RM3SHAL FSP
petrolia gauge NCRWQCB
RM15PT5 FSP
26.5 Mattole Salmon Group
RM40PT6 FSP
RM42PT8 FSP
RM50PT7 FSP
UPMAT2 NCRWQCB
RM56PT5 FSP
RM60PT2 FSP
UPRMAT NCRWQCB
R15 FSP
12 : R14 Redwood Sciences Laboratory
 Click on image to enlarge (101K).
To learn more about this topic click Info Links
| www.krisweb.com |