
| Area | Eastern Mattole |
| Topic | Temperature: Floating Weekly Avg, Mattole Canyon Cr - Upper @8ft, 2001 |
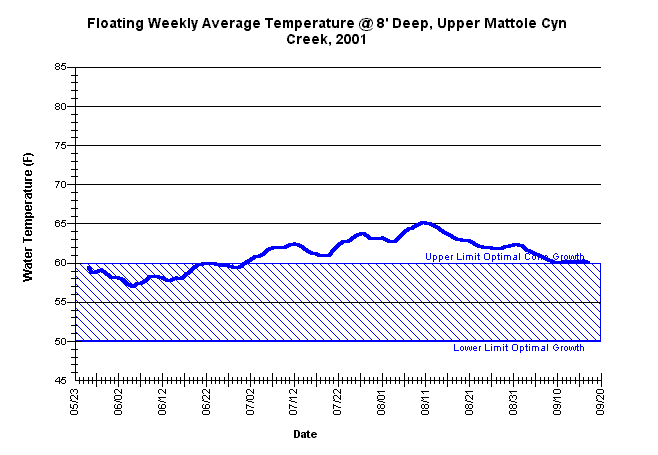
| Caption: The maximum floating weekly average water temperatures for upper Mattole Canyon Creek, approximately 3.1 miles upstream from its confluence with the Mattole River, from May 23 through September, 20, 2001. The thermograph was placed at a depth of approximately 8 feet deep by the Mattole Salmon Group using Forest Science Project protocols. | |
 |
To learn more about this topic click Info Links .
To view a table of information about this data click Metadata .
To view the table with the chart's data, click Chart Table web page.
To download the table with the chart's data, click 86470upmatt_cyn_avgfl.db (size 6,144 bytes) .
To view the table with the chart's source data, click Source Table web page.
To download the table with the chart's source data, click matt_temp_eastmsg_source.dbf (size 978,895 bytes)
| www.krisweb.com |