
| Area | Northern Mattole |
| Topic | Temperature: Min, Max, Avg, East Mill Creek, Late Summer 2001 |
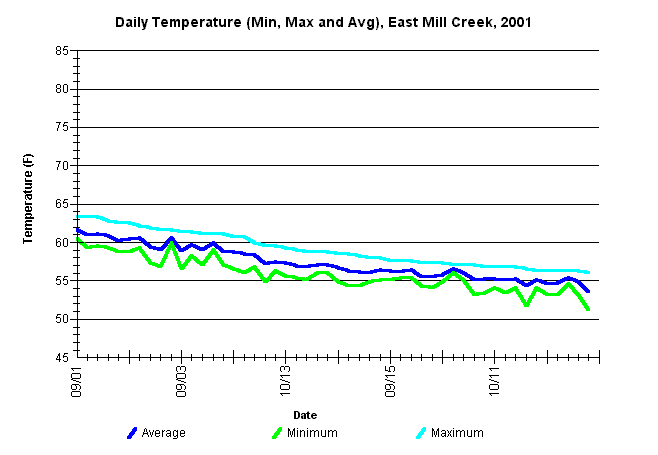
| Caption: The average, minimum and maximum water temperatures from August 21 through October 19, 2001, for East Mill Creek, approximately 1,000 feet upstream from the mainstem Mattole River. The thermograph was placed by the Dept. of Fish and Game from approximately mid-September through mid-October and may not have captured the peak summer maximum temperature. | |
 |
To learn more about this topic click Info Links .
To view a table of information about this data click Metadata .
To view the table with the chart's data, click Chart Table web page.
To download the table with the chart's data, click dfgmill_mma.db (size 6,144 bytes) .
To view the table with the chart's source data, click Source Table web page.
To download the table with the chart's source data, click dfgmill.dbf (size 74,563 bytes)
| www.krisweb.com |