| Area | Southern Mattole |
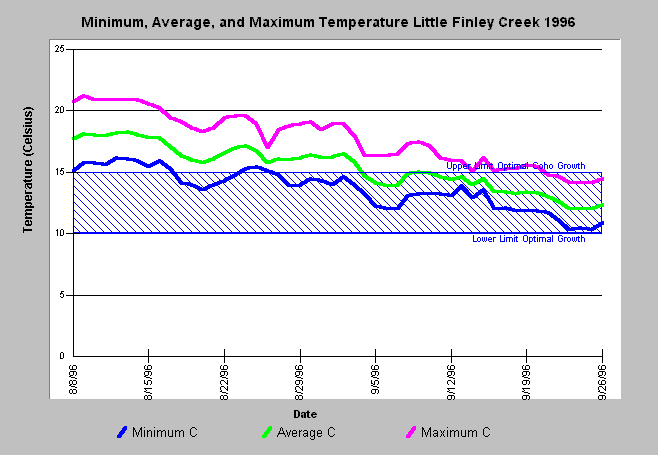
| Topic | Temperature: Min, Max and Avg, Little Finley Creek 1996 |
| Caption: The graph above shows the daily minimum, maximum and average water temperature of Little Finley Creek in 1996. The stream temperature ranges higher than optimal for coho salmon rearing (10-15 C). Data provided by Redwood Sciences Lab. Click on Info Links for more information. | |
 |
To learn more about this topic click Info Links .
To view a table of information about this data click Metadata .
To view the table with the chart's data, click Chart Table web page.
To download the table with the chart's data, click lfinmmxa.dbf (size 6,372 bytes) .
To view the table with the chart's source data, click Source Table web page.
To download the table with the chart's source data, click matole95.dbf (size 2,191,338 bytes)
| www.krisweb.com |
