| Area | Southern Mattole |
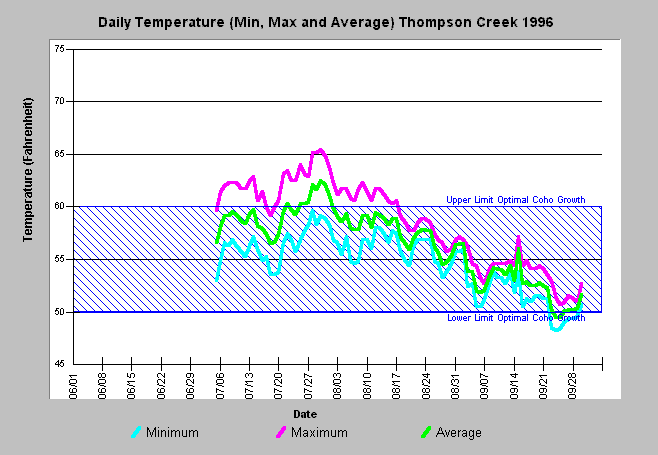
| Topic | Temperature: Min, Max and Avg, Thompson Creek 1996 |
| Caption: The graph above shows the daily minimum, maximum and average water temperature of lower Thompson Creek in 1996. Daily temperature fluctuated 5-7 degrees and rose above the optimal range for coho salmon rearing (50-60 F) for part of the summer period. Data provided by the Forest Science Project. Click on Info Links for more information. | |
 |
To learn more about this topic click Info Links .
To view a table of information about this data click Metadata .
To view the table with the chart's data, click Chart Table web page.
To download the table with the chart's data, click tempraw_fsp_so_daily.db (size 505,856 bytes) .
To view the table with the chart's source data, click Source Table web page.
To download the table with the chart's source data, click tempraw_fsp_so.db (size 2,594,816 bytes)
| www.krisweb.com |
