| Area |
Southern Mattole |
| Topic |
Temperature: Floating Weekly Average, Bridge Creek 1998 |
 Click on image to enlarge (63K). Click here to display a larger version (200K).
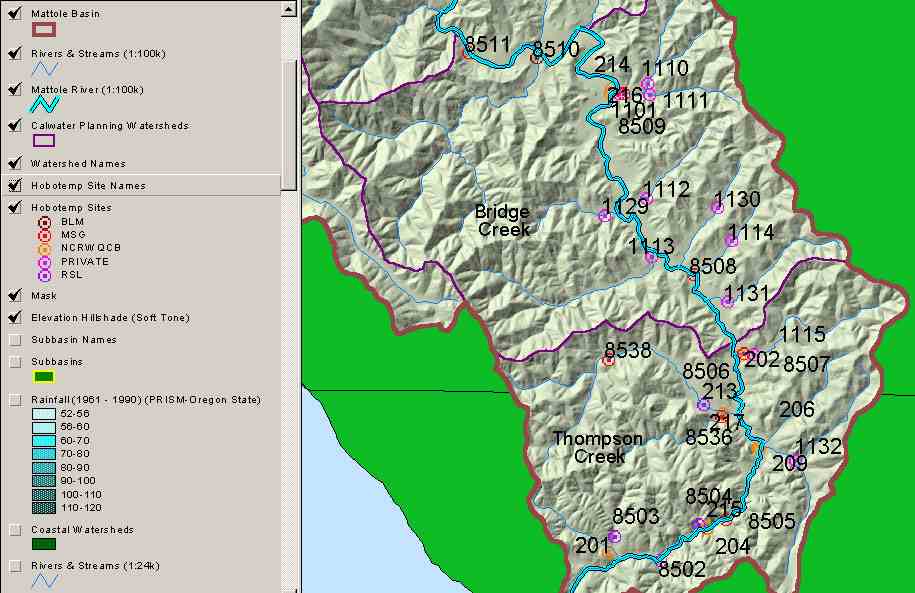
The map image, temsites_fsp_so.jpg, shows temperature recording locations in the Southern Subbasin of the Mattole watershed and for which data was provided by the Forest Science Project. Image taken from KRIS Mattole Maps project (ArcView). The legend at left indicates the originator of data with color coded markers. NCRWQCB sites are in 200 series. Private sites are in 1000 series, and all others are in 8000 series. See Info Links for a table key to location.
To learn more about this topic click Info Links

 Click on image to enlarge (63K). Click here to display a larger version (200K).
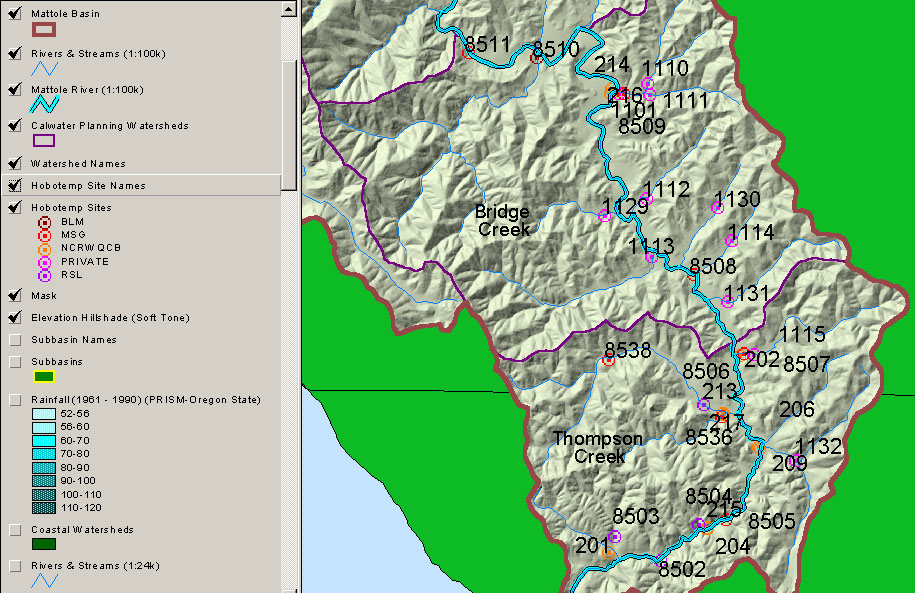