| Area | Basinwide |
| Topic | Temperature: MWAT Distribution in Navarro Basin 2000 |
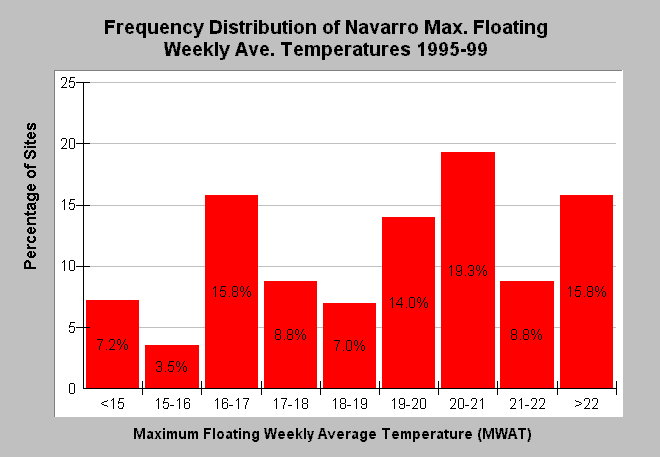
| Caption: The chart shows the percentage of sites within defined ranges of maximum floating weekly average temperature (MWAT) for the Navarro River Basin from 1995-1999. Sites with an MWAT of greater than 16.8 degrees Celsius generally do not support coho salmon (Welsh et al., 2001). The chart is a reproduction of Figure 2-1 in the Navarro River TMDL (U.S. EPA, 2000). See Info Links for more information. | |
 |
To learn more about this topic click Info Links .
To view additional information (data source, aquisition date etc.) about this page, click Metadata .
To view the table with the chart's data, click Chart Table web page.
To download the table with the chart's data, click temp_excd_tmdl.dbf (size 269 bytes) .
| www.krisweb.com |
