
| Area | Basinwide |
| Topic | Tour: Current vs. Potential Shade and Temperature, TMDL |
This figure shows a map of current versus potential effective shade for the Navarro River and its tributaries from the Navarro River TMDL (U.S. EPA, 2000). The results come from UC Davis' Information Center for the Environment using a model they developed called RIPTOPO.
This figure shows a map of current versus potential stream temperatures for the Navarro River Basin as presented in the Navarro River TMDL (U.S. EPA, 2000). Potential shade was calculated using the RIPTOPO model output by UC Davis' ICE. Shade values were established as a function of channel width, aspect and vegetation type. See Info Links for more information.
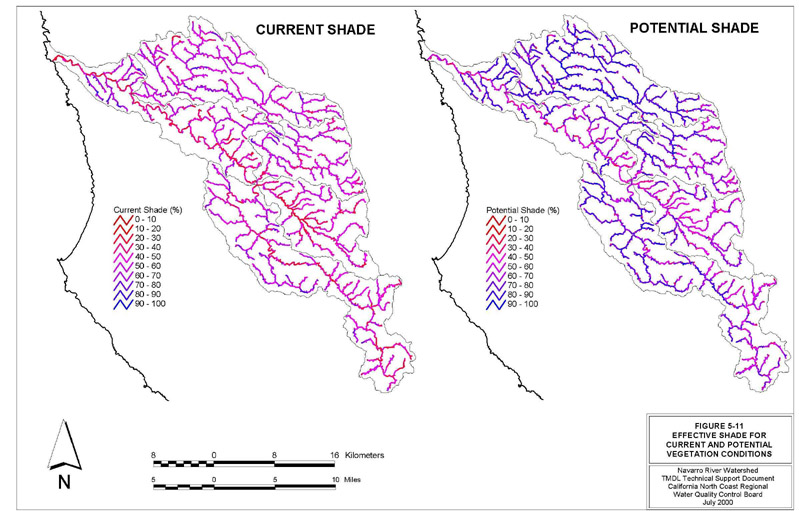 Click on image to enlarge (144K).
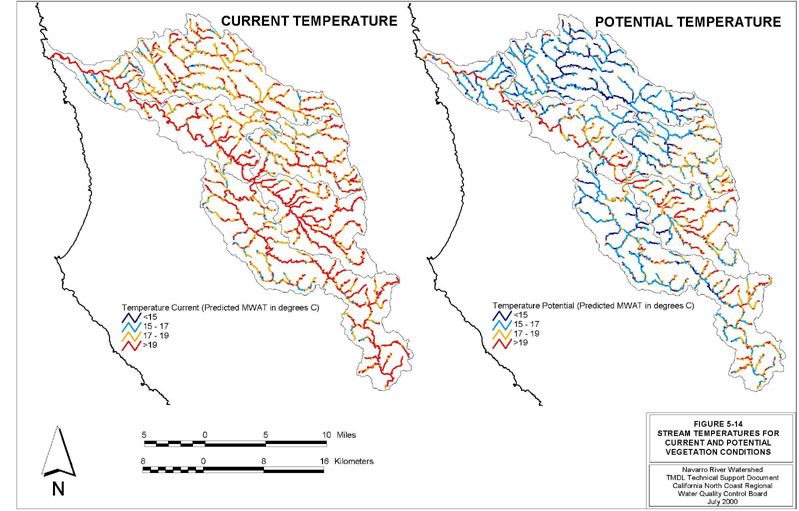 Click on image to enlarge (136K).
To learn more about this topic click Info Links
To view additional information (data source, aquisition date etc.) about this page, click Metadata
| www.krisweb.com |