| Area | Greenwood Creek |
| Topic | Sediment: Vwave for Greenwood Creek 1995 |
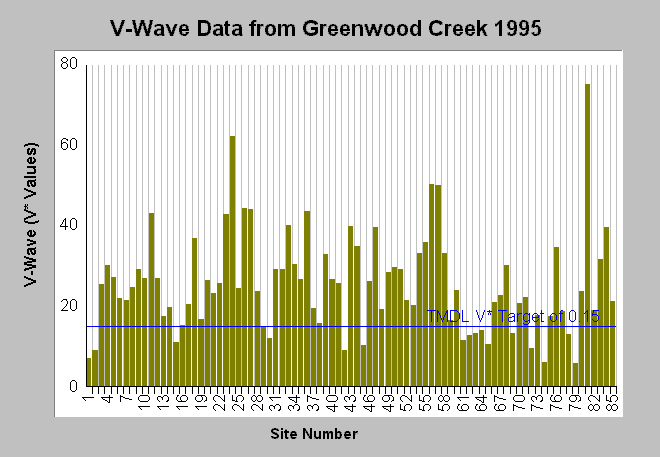
| Caption: The chart shows V-wave data for Greenwood Creek collected in 1995 by Forest, Soil and Water (1999). This study measured V* for 85 pools spanning the length of Greenwood Creek. V* values are shifted two decimal places to make whole number for ease of reading. The mean pool filling by sediment was 0.25 which is roughly 25% filled with sediment which is over the Navarro TMDL threshold for V* of 0.15. Two pools per site, if present, were probed for pool and sediment depth in up to 48 evenly spaced points, and the weighted average of sedimentation for those points is presented as V-wave. Click on Info Links for more information. | |
 |
To learn more about this topic click Info Links .
To view additional information (data source, aquisition date etc.) about this page, click Metadata .
To view the table with the chart's data, click Chart Table web page.
To download the table with the chart's data, click vwave.dbf (size 4,168 bytes) .
| www.krisweb.com |
