
| Area | Greenwood Creek |
| Topic | Temperature: FWA at upper Greenwood Cr (Site 84-3) 1994-2001 |
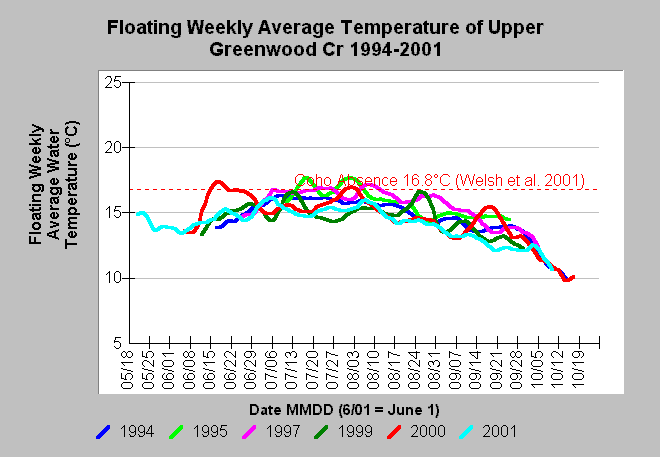
| Caption: The chart shows the floating weekly average water temperature in Celsius (°C) at upper Greenwood Creek (Site 84-3) for the years 1994-95, 1997, 1999-2001. Maximum floating weekly average temperatures exceeded 16.8°C in three of six years measured, with 1995, 1997 and 2000 over the reference value shown on the chart. Welsh et al. (2001) found that coho are not likely to persist where maximum floating weekly average temperature (MWAT) exceeds 16.8°C. See Info Links for more information. Temperature data provided by the Mendocino Redwood Company. | |
 |
To learn more about this topic click Info Links .
To view additional information (data source, aquisition date etc.) about this page, click Metadata .
To view the table with the chart's data, click Chart Table web page.
To download the table with the chart's data, click temp_greenwd_daily.db (size 102,400 bytes) .
To view the table with the chart's source data, click Source Table web page.
To download the table with the chart's source data, click greenwood_temps.dbf (size 711,044 bytes)
| www.krisweb.com |