| Area | Mainstem |
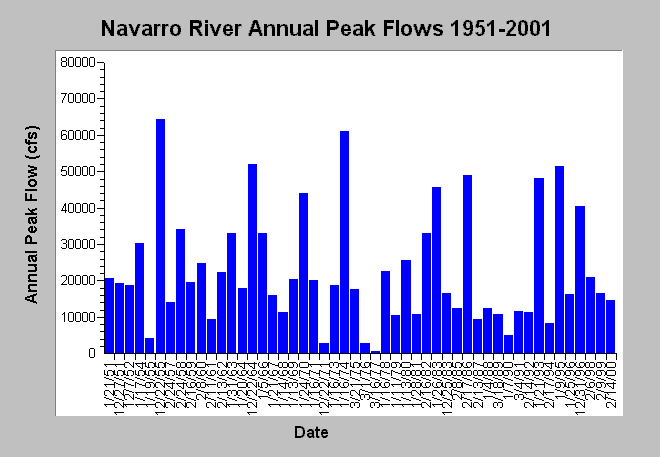
| Topic | Flow: Navarro River - Peak Flows, 1951-2001 |
| Caption: This chart displays annual peak flows (cfs) in the Navarro River near Navarro, CA for the years 1951-2001. The maximum peak flow of record occurred on 12/22/1955 (64,500 cfs) and the minimum occurred on 3/7/1977 (630 cfs). Data are compiled by the US Geological Survey from streamflow measurements gathered at USGS gage #11468000 from water years 1951 and 2001. See Info Links for more information. | |
 |
To learn more about this topic click Info Links .
To view additional information (data source, aquisition date etc.) about this page, click Metadata .
To view the table with the chart's data, click Chart Table web page.
To download the table with the chart's data, click flow_navarro_usgs11468000_peak_1951_2001.dbf (size 1,998 bytes) .
| www.krisweb.com |
