| Area | Mainstem |
| Topic | Flow: Navarro River - Runoff vs. Flows, 1951-1988 |
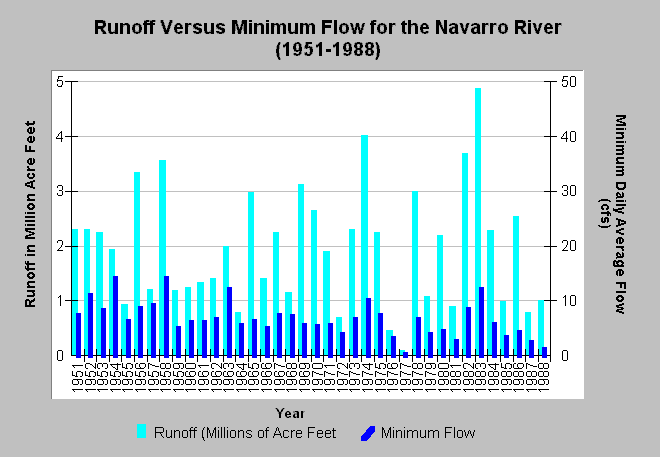
| Caption: This chart shows the total estimated runoff from the Navarro River watershed as calculated by Jackson (1991) on the left axis in millions of acre feet (MAF) and minimum daily flow in cubic feet per second from the USGS stream gauge (11468000) near the mouth of the river from 1951 to 1988 on the right y-axis. Years are water years (i.e. 1951 = Oct 1, 1950-Sept 30, 1951). Jackson (1991) found that there was a pattern of lower surface flows for the amount of runoff between 1950 and 1988. A comparison of flow versus runoff for the water year 1955 (0.94 MAF and 6.2 cfs) with 1985 (0.99 MAF and 3.3 cfs) and 1988 (1 MAF and 1.1 cfs) is illustrative. See Info Links for more information. | |
 |
To learn more about this topic click Info Links .
To view additional information (data source, aquisition date etc.) about this page, click Metadata .
To view the table with the chart's data, click Chart Table web page.
To download the table with the chart's data, click runoff_flow_jackson_1950_1988.dbf (size 1,194 bytes) .
| www.krisweb.com |
