| Area | Mainstem |
| Topic | Stream Channel: Longitudinal Profile of Floodgate Landslide 1995-99 |
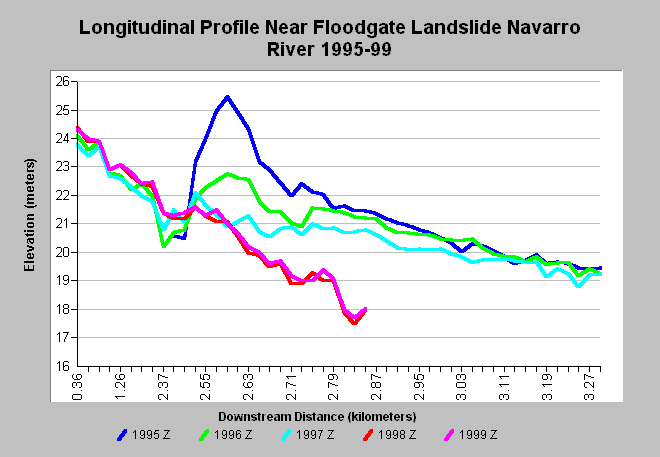
| Caption: This chart shows longitudinal profiles of the mainstem Navarro River upstream and downstream of the sediment pulse created by the Floodgate Slide in 1995. The large hump near river kilometer 2.5 shows the initial size of the landslide in the river. Upstream of the slide, all mean bed elevations are cross sections. Downstream, from 1995-97 the profiles are 20-m averages of all bed points (0-20 plotted at 10m, 20-40 plotted at 30 m, etc.). In 1998 and 1999 points are cross-sections both upstream and downstream of the slide. Data were provided by Diane Sutherland, Redwood Sciences Lab, Arcata, CA. | |
 |
To learn more about this topic click Info Links .
To view additional information (data source, aquisition date etc.) about this page, click Metadata .
To view the table with the chart's data, click Chart Table web page.
To download the table with the chart's data, click suth_fldgte_sed.dbf (size 10,000 bytes) .
| www.krisweb.com |
