
| Area | Rancheria Creek |
| Topic | Temperature: FWA at Rancheria Cr - lower (Site 008) 1995-96 |
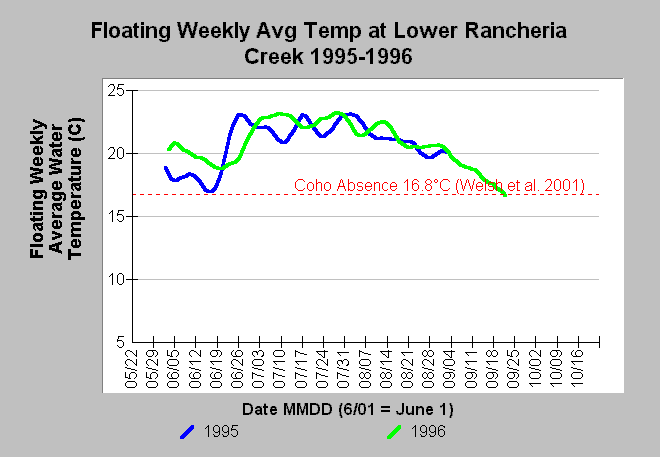
| Caption: The Chart above shows the floating weekly average water temperature in Celsius (°C) of lower Rancheria Creek (Site 008) for the years 1995-96. Floating weekly average water temperatures exceeded 16.8°C for long durations during both years. Welsh et al. (2001) found that coho are not likely to persist where maximum floating weekly average temperature (MWAT) exceeds 16.8°C. See Info Links for more information. Temperature data provided by the Mendocino County Water Agency (MCWA). | |
 |
To learn more about this topic click Info Links .
To view additional information (data source, aquisition date etc.) about this page, click Metadata .
To view the table with the chart's data, click Chart Table web page.
To download the table with the chart's data, click ranchxtab.db (size 161,792 bytes) .
To view the table with the chart's source data, click Source Table web page.
To download the table with the chart's source data, click temperature_proxy.dbf (size 80 bytes)
| www.krisweb.com |