
|
Area/Topic | Bibliography | Background | Hypotheses | Home |
|
Map Page.
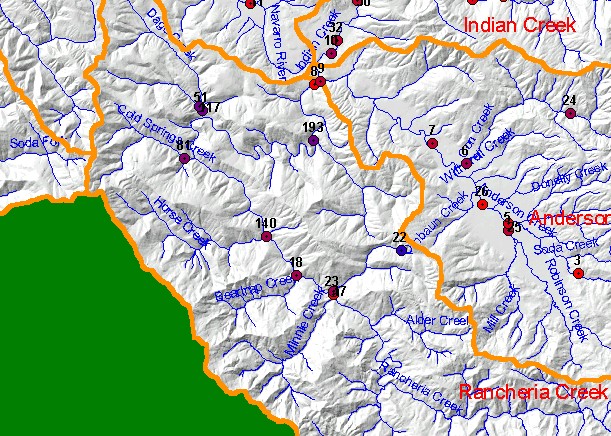
You selected the area Rancheria Creek and the topic Temperature: MMA at Dago Creek (Site 051) 1997 |
| This map shows temperature monitoring stations in the northern portion of the Rancheria Creek sub-basin, displayed with 1:24,000 scale streams and KRIS sub-basins. Temperature sites are color-coded by their maximum floating weekly average temperature (MWAT). Welsh et al. (2001) found that coho are not likely to persist where maximum floating weekly average temperature (MWAT) exceeds 16.8°C. Data were contributed by Mendocino County Water Agency and Mendocino Redwoods Company. | |||
|
|
||
To view metadata about a map layer, click on a link in the table below.
| Name of Layer in Map Legend | Metadata File Name |
|---|---|
| Temperature Pts (labels only) | regional_tempsites_nav.shp.txt |
| Temperature Pts (Average MWAT) | regional_tempsites_nav.shp.txt |
| Sub-basins (w/ labels) | subbasins.shp.txt |
| Project Frame | Unavailable |
| Streams (1:24k scale)(w/ labels) | streams24.shp.txt |
| USFS Riparian Veg Size | vegsizebuf.tif.txt |
| Topo Map (1:24k scale) | Unavailable |
| Graycale Hillshade (TIFF) | grayscale_xnv_light.tif.txt |
| www.krisweb.com |