Maps in KRIS Redwood Creek

 |
The KRIS
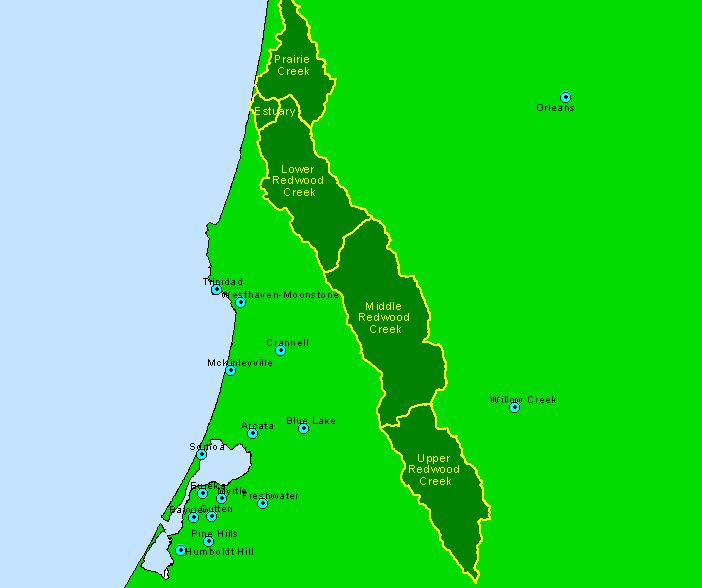
Redwood Creek Map project is built to support watershed analysis and contains
a wealth of useful data (study sub-basins at left). The KRIS Redwood Creek
Map project comes on a companion CD to the KRIS Redwood Creek database.
This electronic map project is built in ArcView but ArcExplorer projects
have also been constructed for those who do not own the ArcView software.
Arc Explorer software is free from the Earth Science Research Institute
(ESRI) and is included on the map CD. The map data are useful for further
research and map construction and have been assimilated by the Institute
for Fisheries Resources from a number of sources: |
- California Department
of Forestry
- California Department
of Fish and Game
- California Regional
Water Quality Control Board
- Redwood National Park
- U.S. Environmental Protection
Agency
- U.S. Forest Service
Spatial Analysis Lab, Sacramento
- U.S. Geological Survey
KRIS Redwood Creek Maps
includes several types of ArcView projects. The basic project will run with
ArcView 3.2 without extensions (i.e. redwoodck.apr). Projects with grid information,
such as Landsat vegetation, require ArcView with the Spatial Analyst extension
(i.e. redwoodck_sa.apr). The slope modeling project in KRIS Redwood Creek Maps
requires 3D Analyst but is also vended as an image which appears in both other
projects. Similarly, grid data, such as vegetation data from Landsat, are also
transformed into images so that those without Spatial Analyst can use them,
although without the power of running data queries. Once projects are open,
the user may add themes and re-organize views for analysis. Full metadata for
all data layers is contained in the KRIS Redwood Creek Map project and can now
be accessed inside projects by hitting a metadata (M) button scripted by Dr.
Jan Derksen.
The KRIS Redwood Creek
Map project was carried out by the Institute for Fisheries Resources KRIS Project
office in Arcata. Similar projects for the Noyo River, Big River, Gualala, Mattole
and Ten Mile River basins are available as part of those KRIS projects. Data
have been compiled as four views containing a logical grouping of themes: Land
Cover, Fish and Aquatic Habitat, Geology, and DOQs. The latter is a photographic
image layer with pictures roughly equivalent to a USGS Topographic quadrangle.
Some map samples appear below, with tips for their use in analysis. Unfortunately,
the project is somewhat incomplete because of problems related to data sharing
(see note). The complete KRIS Maps Redwood
Creek project is available on CD from the California Department of Forestry
(call (916) 227-2652).
 |
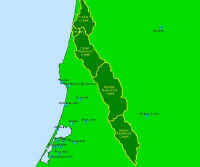
Although
much of lower Redwood Creek and Prairie Creek are in Redwood National and
State Parks, the upper Redwood Creek watershed is mostly privately owned.
Small parcels of U.S. Forest Service and Bureau of Land Management can be
seen in upper Redwood Creek on Board Mountain and on the eastern side in
the Middle Redwood Creek sub-basin. Ownership data from Redwood National
Park. |
 |
Ten
meter elevation data from the California Department of Forestry were used
to construct this hillshade model showing elevation in the Redwood Creek
basin. Elevation ranges from sea level to 5200 feet. Notice that the steeper
terrain is in the upper watershed. Steeper slopes are often associated with
higher erosion potential. Higher elevation areas are subject to snowfall,
which may alter hydrologic response to land use because of potential changes
in runoff associated with rain-on-snow events. |
 |
Rainfall
in the Redwood Creek basin increases in steeper upper watershed areas in
the headwaters, where rainfall may reach 90 inches per year. Increased rainfall
is associated cooling air at higher elevations, which causes more moisture
to drop from storm clouds coming in off the Pacific Ocean in winter. Rainfall
on the coastal plain near Orick at the mouth of Redwood Creek is nearer
50 inches. Rainfall isopleths constructed from Oregon State University regional
model. |
 |
The
vegetation and timber types used in KRIS projects were derived from Landsat
multi-spectral images taken in 1994 and show large diameter trees in Redwood
National and State Parks in the northern part of the Redwood Creek watershed.
Although some natural meadows exist on the eastern side of the basin, much
of the small diameter tree sizes in the upper basin are due to recent logging.
The U.S. Forest Service Pacific Southwest Regional Remote Sensing Lab, in
cooperation with the California Department of Forestry, analyzed the Landsat
images to formulate a California-wide electronic map layer of vegetation
as part of the Northwest Forest Plan (Warbington et al., 1998). |
 |
The
image at left is also of vegetation derived from a 1994 Landsat image, but
interpreted by the U.S. Environmental Protection Agency. The EPA is most
interested in agricultural and urbanization because of substantial potential
impacts from these land uses in much of the U.S. In Redwood Creek, only
minor amounts of land are farmed in the Orick and Redwood Valley areas.
The EPA Land Cover also shows a great deal of mixed forest (hardwood/conifer)
and shrubland, which except on prairies to the east is as a result of recent
timber harvest. Black areas are recent clear cuts that have so little ground
cover that it reads as transitional, or cleared for development. |
 |
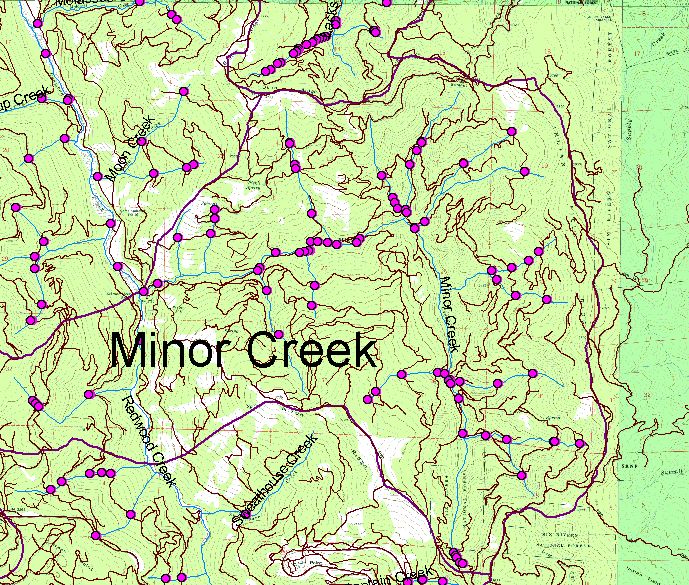
Roads
in the upper Redwood Creek basin were mapped by Redwood National Park (at
left) and the pink dots are where roads cross streams. Road-stream crossings
are extremely important in watershed analysis because crossing failure during
storms is often the largest contributor of sediment to streams (Hagans et
al., 1986). Those streams that are crossed several times by roads have greater
risk of sediment evulsions because if one road high in the drainage fails,
all culverts below will also be washed out. Road densities should be less
than 2.5 miles per square mile with few stream side roads to meet National
Marine Fisheries Service (1996) fully functional condition. |
 |
Timber
harvest in Redwood Creek since 1985 were mapped by the California Department
of Forestry and provided for use in the KRIS Redwood Creek Map project.
Timber harvest in some areas of the Middle and Upper Redwood Creek sub-basins
has been active in this period. Reeves et al. (1993) found that watersheds
cut in over 25% of their watershed area were likely to have streams with
diminished habitat diversity and fewer species of Pacific salmon. The widespread
nature of timber harvest in some Redwood Creek sub-basins increases the
risk of cumulative watershed effects (Higgins, 2002). |
 |
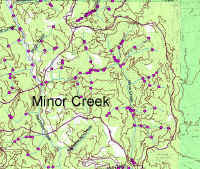
The
image at left shows the Shallow Landslide Stability Model (SHALSTAB) overlain
on a USGS topographic map for the Minor Creek Calwater Planning Watershed.
The relative risk of slides is high in the eastern area of the Calwater,
where Minor Creek is deeply incised and tributaries also show high risk
characteristic of inner gorge locations. These location were taken out of
active timber harvest on U.S. Forest Service lands as part of the Northwest
Forest Plan (FEMAT, 1993) because of inordinate risk of landslides and direct
contribution of sediment to streams. See the Background page on SHALSTAB
for more information. Landslide information from the California Geologic
Service were not made available to IFR. |
 |
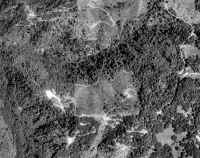
The
image at left shows the changes on the landscape of the Minor Creek Calwater
between 1994 and 1998, according to "change scene detection" using
sequential Landsat images. The backdrop is the Lord Ellis digital orthophoto
quad. While red and orange areas show reduction in canopy, light greens
indicate improving ground cover on clear cuts. Change scene data provided
by the California Department of Forestry Forest Range Assessment Program,
Sacramento, CA. |
 |
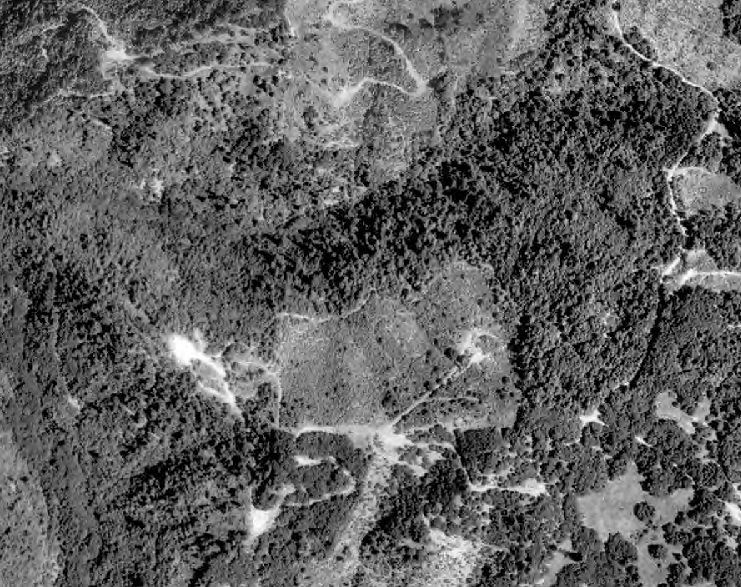
This
zoom in to the same Lord Ellis orthophoto shows recent clear cuts, young
forest and high road densities on the east side of the Minor Creek drainage.
KRIS Map projects used compressed orthos derived by using Mr. Sid compression
technology, which is compatible with ArcView. The level of detail maintained
through compression is sufficient for review of landscape condition
but not for tasks such as measuring tree crown diameter or other exercises
that require high detail. |
 |
The
stream gradient of Minor Creek and the mainstem Redwood Creek (at left)
are shown at left on a USGS topographic map backdrop. Stream gradient data
are derived from 10 meter elevation provided by CDF FRAP, which also derived
the script for applying to streams. The red segments are supply reaches
(>20%), where any sediment delivered to the channel is likely to be transported
immediately down slope. Sections of the stream between 4% and 20% gradient
are transport reaches (orange, dark purple) and response reaches are those
less than 4% (lavender and dark and light blue). The latter were once the
most productive spawning and rearing habitats but they are also reaches
where sediment tends to remain in residence for longer periods. |
 |
Stream
order, according to the Strahler method, can also be viewed in the KRIS
Redwood Creek Map project. This method of gauging stream power and size
can also be derived in an automated way using 10 meter elevation data. Scripts
for the derivation of stream order are the same as those provided by CDF
for the stream gradient theme. |
 |
The
California Department of Fish and Game performed extensive habitat typing
surveys in the Redwood Creek basin as part of NCWAP in 2001. The results
at left show pools deeper than four feet in some places on the mainstem
Redwood Creek and upstream in steeper reaches of Minor Creek to the right.
Both the mainstem above and below the convergence with Minor Creek and the
lower reaches of the creek itself lack deeper pools. Other themes include
pool frequency by length, embeddedness and canopy. |
 |
The
riparian condition of Redwood Creek has been mapped from aerial photos for
every period between 1948 and 1997 by Redwood National Park. The image at
left shows the riparian condition of the mainstem Redwood Creek at the convergence
with Minor Creek in 1997. Non-spatial summary data for making charts from
these data were not obtained from RNP. |
 |
Cross
sections have also been measured by Redwood National Park at a number of
locations. The cross section stations are represented on the map at left
with the Lord Ellis orthophoto showing as a backdrop. Cross section data |
References
FEMAT [Forest Ecosystem Management Assessment Team].
1993. Forest Ecosystem Management: an ecological, economic and social assessment.
Report of the Forest Ecosystem Management Assessment Team. 1993-793-071. U.S.
Govt. Printing Office.
Hagans,
D.K., W.E. Weaver, and M.A. Madej. 1986. Long term on-site and off-site
effects of logging and erosion in the Redwood Creek basin, northern California.
Pages 38-66, in: National Council of the Paper Industry for Air and Stream Improvement,
Inc. (NCASI) technical bulletin no. 490. NCASI, New York, NY. [817k]
Higgins,
P.T. 2002. Comments on the Draft Simpson Resources Company Habitat Conservation
Plan and Environmental Impact Statement. Sent to U.S. Fish and Wildlife Service
and National Marine Fisheries Service for consideration in review. Patrick Higgins,
Consulting Fisheries Biologist, Arcata, CA. 30 p.
National
Marine Fisheries Service. 1996. Coastal Salmon Conservation: Working Guidance
for Comprehensive Salmon Restoration Initiatives on the Pacific Coast. US Dept.
Commerce, NOAA. 4 pp.
Reeves,
G.H., F.H. Everest, and T.E. Nickleson. 1989. Identification of Physical
Habitats Limiting the Production of Coho Salmon in Western Oregon and Washington.
General Technical Report PNW-GTR-245. USDA Forest Service, Pacific Northwest
Research Station. Portland, OR. 25 pp. [396k]
Warbington,
R., B. Schwind, C. Curlis and S. Daniel. 1998. Creating a Consistent and
Standardized Vegetation Database for Northwest Forest Plan Monitoring in California.
USDA Forest Service. Pacific Southwest Region Remote Sensing Lab. Sacramento,
CA. [45k]