
| Area | General |
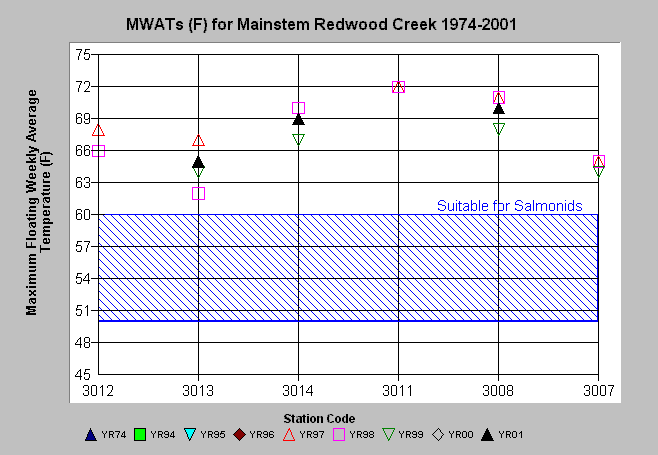
| Topic | Temperature: MWATs at All Mainstem Redwood Creek Sites (1994-2001) |
| Caption: Maximum floating weekly average temperature (MWAT) values for all years of data are plotted here for comparison to the "fully suitable MWAT range for salmonids" according to NCWAP/EMDS criteria. Mainstem Redwood Creek was found unsuitable for rearing salmonids in all years measured and at all sites. See Info Links for more information. | |
 |
To learn more about this topic click Info Links .
To view a table of information about this data click Metadata .
To view the table with the chart's data, click Chart Table web page.
To download the table with the chart's data, click mwat_main.dbf (size 1,504 bytes) .
To view the table with the chart's source data, click Source Table web page.
To download the table with the chart's source data, click all_mwats.dbf (size 5,350 bytes)
| www.krisweb.com |