|
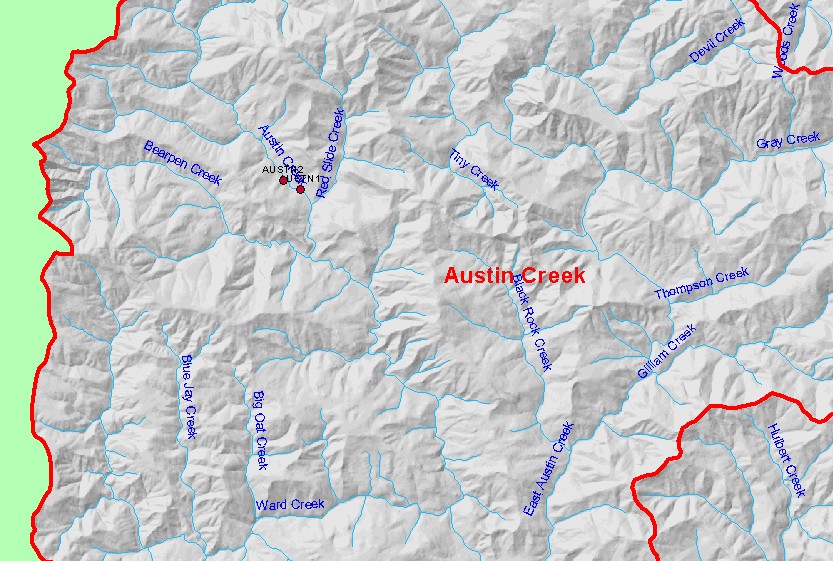
This map shows temperature monitoring stations in the Austin Creek sub-basin, displayed with USGS 1:100,000 scale streams, sub-basins, and a grayscale hillshade.
Data were contributed by Sonoma County Water Agency (SCWA). Geographic coordinates supplied by SCWA for the two Austin sites were only 300 meters apart,
but floating weekly average temperatures at those sites differ by approximately five degrees Celsius, indicating that the coordinates are unreliable and that the sites were
actually miles apart. Scale = 1:60,467 .
|
|