| Area | Basin-wide/Regional |
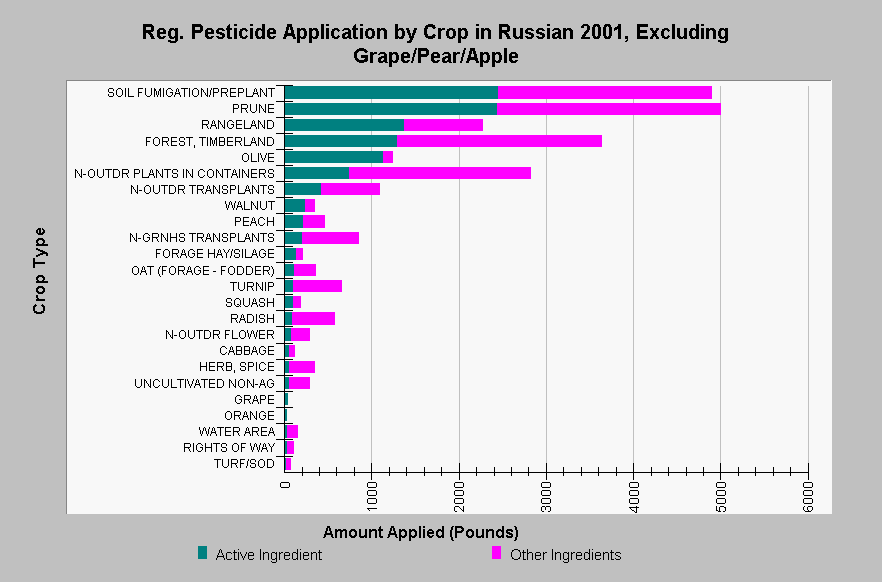
| Topic | Pesticides: Amount Applied in Russian Basin, by Crop, Minor Crops 2001 |
| Caption: This chart shows the amount of registered pesticides applied to various crop types in Russian basin during the year 2001. The three biggest pesticide users (wine grapes, apples, and pears) are excluded from this graph, as are the nine crop types that use less than 25 pounds each. Note that significant portions of the basin are not included in the database (see Map). Other ingredients include any solvents, surfactants, propellants, or other chemicals included in product formulations. Data are from the California Pesticide Use Reporting Database, which was assembled by the California Department of Pesticide Regulation. See InfoLinks for more information. | |
 |
To learn more about this topic click Info Links .
To view additional information (data source, aquisition date etc.) about this page, click Metadata .
To view the table with the chart's data, click Chart Table web page.
To download the table with the chart's data, click pesticide_rus_dpr_2001_lbs_crop24.dbf (size 2,466 bytes) .
To view the table with the chart's source data, click Source Table web page.
To download the table with the chart's source data, click pesticide_rus_dpr_2001_lbs_crop36.dbf (size 3,618 bytes)
| www.krisweb.com |
