| Area | Basin-wide/Regional |
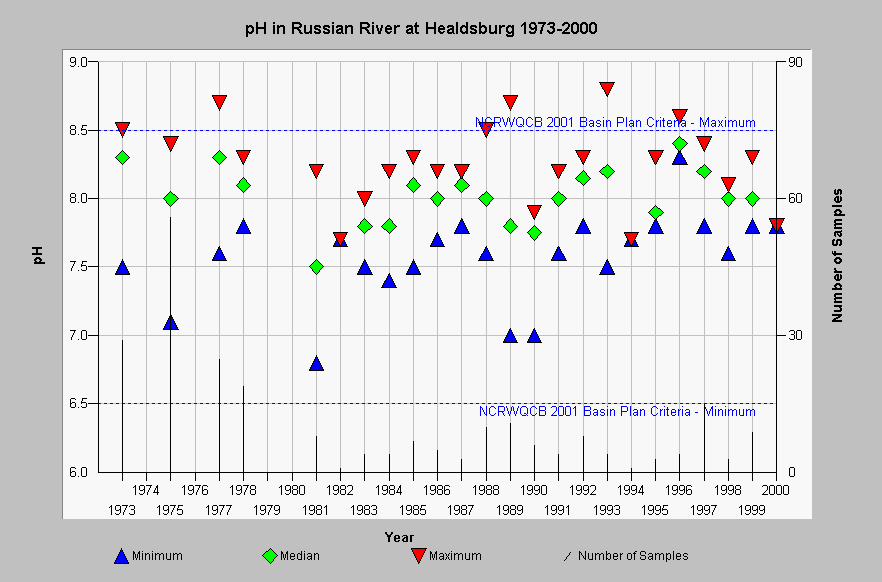
| Topic | WQ: 1973-2000 pH in Russian River at Healdsburg Memorial Beach |
| Caption: This chart shows average pH for all measurements in the Russian River at Healdsburg Memorial Beach for the period 1973-2000. Data were provided by the North Coast Regional Water Quality Control Board (NCRWQCB). Number of samples per year is plotted on the second y-axis to show variable sampling effort. Earlier years had more sampling intensity, in general. See InfoLinks for more information. | |
 |
To learn more about this topic click Info Links .
To view additional information (data source, aquisition date etc.) about this page, click Metadata .
To view the table with the chart's data, click Chart Table web page.
To download the table with the chart's data, click rr_waterquality_jd_ph.db (size 18,432 bytes) .
To view the table with the chart's source data, click Source Table web page.
To download the table with the chart's source data, click rr_waterquality_jd.dbf (size 3,141,378 bytes)
| www.krisweb.com |
