| Area | Forsythe Creek |
| Topic | Sediment: Turbidity vs Suspended Sediment - Forsythe Cr 1974-1980 |
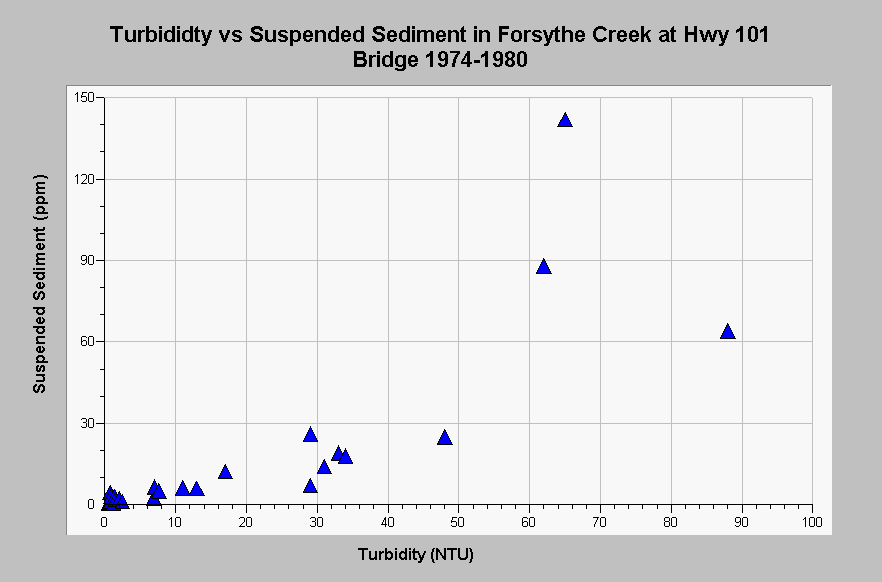
| Caption: This chart show the relationship between turbidity (NTU) and suspended sediment concentration (ppm) in Forsythe Creek ant the Hwy. 101 bridge. Suspended sediment is often used to estimate bedload. Data were collected in 1974-1980 by Caltrans, Eureka District and was reported by California Department of Water Resources (1984). Note that the data are limited (n=27) especially for higher NTU values. See InfoLinks for more information. | |
 |
To learn more about this topic click Info Links .
To view additional information (data source, aquisition date etc.) about this page, click Metadata .
To view the table with the chart's data, click Chart Table web page.
To download the table with the chart's data, click sed_forsythe_turbidity_suspended_sed_1974_1980.dbf (size 611 bytes) .
| www.krisweb.com |
