
|
Area/Topic | Bibliography | Background | Hypotheses | Home |
|
Map Page.
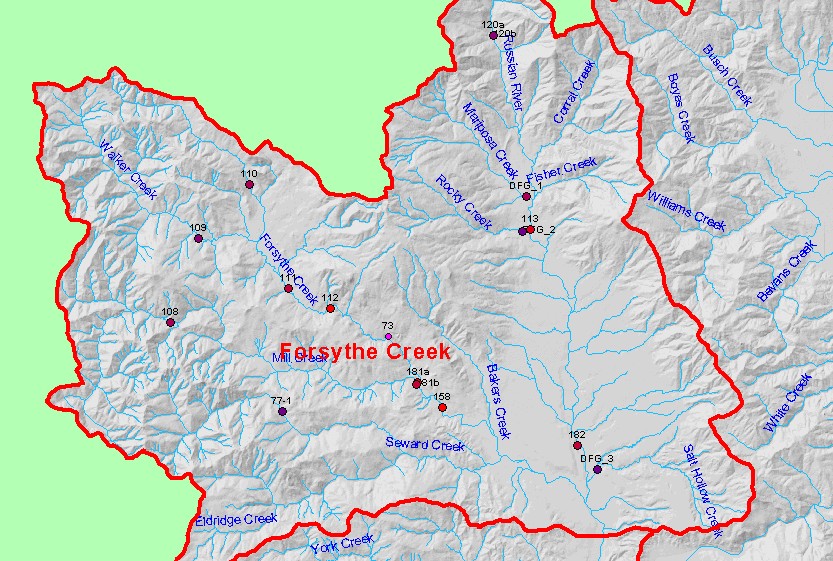
You selected the area Forsythe Creek and the topic Temperature: Min, Max, Avg at Forsythe Creek - Lwr (158), 1999 |
| This map shows temperature monitoring stations in the southern end of the Ukiah sub-basin, displayed with USGS 1:24,000 scale streams, sub-basins, and a grayscale hillshade. Data were contributed by Mendocino County Water Agency, California Department of Fish and Game, and Mendocino Redwoods Company. Scale = 1:107,922 . | |||
|
|
||
| www.krisweb.com |