| Area | Guerneville |
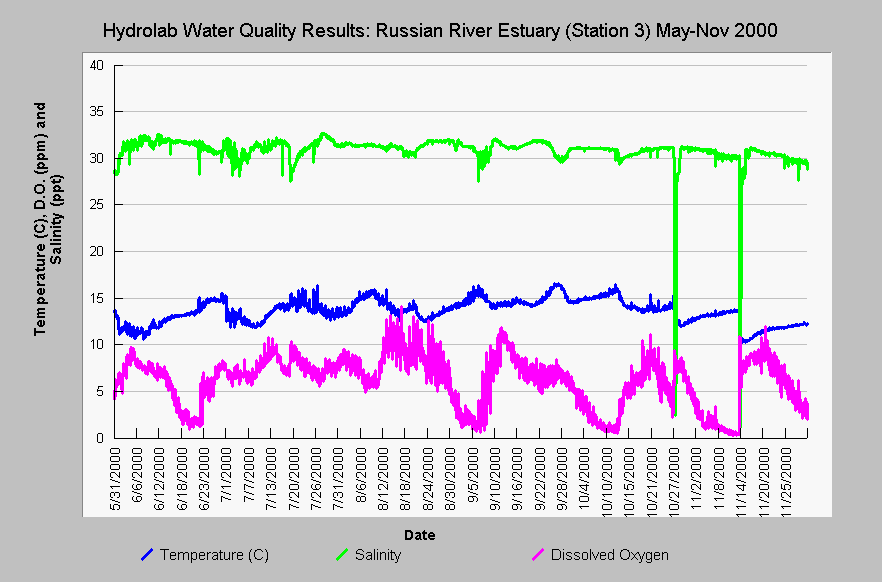
| Topic | WQ: Estuary 2000 Hydrolab Temp, Salinity and DO Station #3 May-Nov |
| Caption: An automated Hydrolab data probe was placed in the deepest part of the Russian River estuary channel at Willow Creek (Station #3) from May 31 to November 4, 2000 and temperature, salinity and dissolved oxygen measurements are shown above. MSC (2001) noted that: "It appears that salinity stratification is usually present within the Estuary and that the freshwater lens fluctuates in depth based upon tides, river flows, and bar-open or bar-closed conditions. Minisonde records at Station 3 in 2000 show that near-bottom salinity levels ranged between 28 and 32 ppt in 2000, regardless of whether the sandbar was open or closed. DO levels appear to be more closely connected with bar conditions, usually staying above 5.0 ppm when the bar was open, and dropping below 5.0 ppm when the sandbar is closed. It appears to take more than one tidal cycle for the DO levels to recover...Following several artificial breaching events, salinity levels would decline dramatically within one or two days only to rebound to previous levels within hours of the initial decline." Breaching events were 9/6, 10/12, 10/28, and 11/8. See the Picture tab for monitoring locations. Click on InfoLinks for more information. | |
 |
To learn more about this topic click Info Links .
To view additional information (data source, aquisition date etc.) about this page, click Metadata .
To view the table with the chart's data, click Chart Table web page.
To download the table with the chart's data, click wq_sond_3_may_nov2000date.dbf (size 156,294 bytes) .
| www.krisweb.com |
