
| Area | Guerneville |
| Topic | WQ: Estuary Temp, Salinity and DO Grab Sta #3 10/8/98 During Breach |
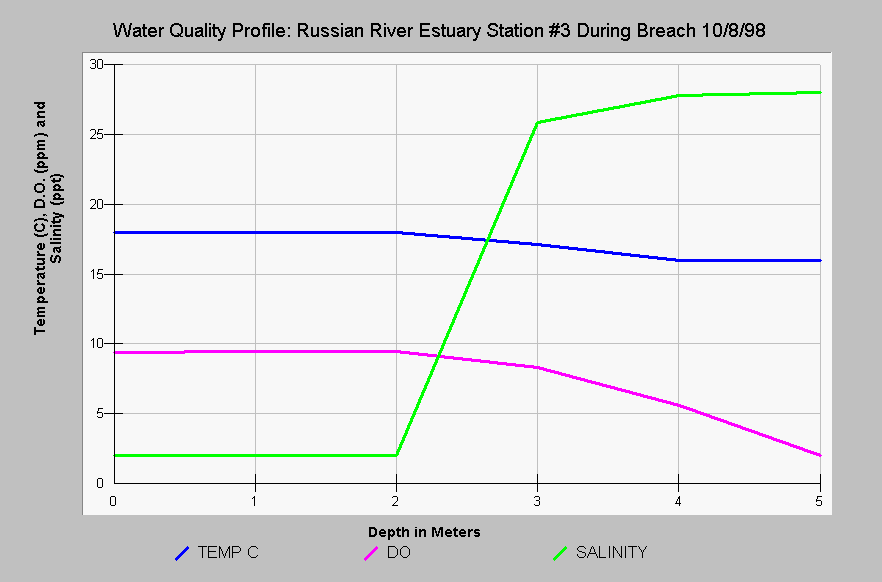
| Caption: This chart shows the Russian River estuary temperature in Celsius, dissolved oxygen (DO) in parts per million (ppm) and salinity in parts per thousand (ppt) at Station #3 just after breaching on October 8, 1998 versus the depth in meters. The water quality profile remained very similar to the pre-breaching conditions. Deep water stations well away from the mouth may have a lag time of several tidal cycles or days in terms of deep water locations before oxygen levels rise. Data provided by Merritt-Smith Consulting (1999) from a study performed for Sonoma County. See InfoLinks for more information on study methods and results. | |
 |
To learn more about this topic click Info Links .
To view additional information (data source, aquisition date etc.) about this page, click Metadata .
To view the table with the chart's data, click Chart Table web page.
To download the table with the chart's data, click wq_grab_oct_9_1998_sta3.dbf (size 1,730 bytes) .
To view the table with the chart's source data, click Source Table web page.
To download the table with the chart's source data, click wq_grab_oct_1998_event.dbf (size 7,706 bytes)
| www.krisweb.com |