
| Area | Geyserville |
| Topic | Temperature: Floating Weekly Avg, Russian R. in Geys. Sub-basin, 2000 |
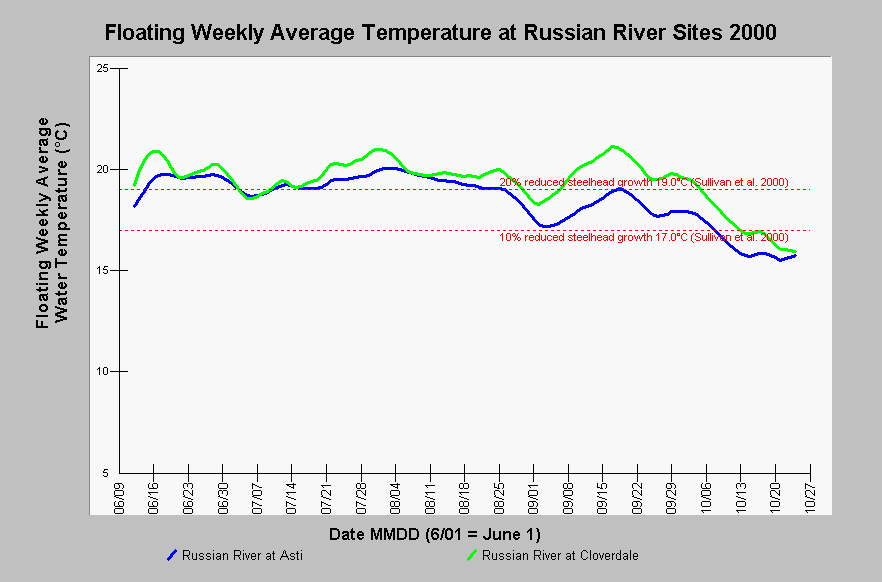
| Caption: This Chart shows the floating weekly average water temperature in the Russian River at Asti and Cloverdale (sites ASTW and CLOW, respectively) for the year 2000. The river cooled 0-0.2°C as it flowed from the Cloverdale site to the Asti site. This is interesting, because water temperatures usually increase as a river flows downstream. Maximum floating weekly average water temperatures (MWAT) exceeded 19.0°C at both sites. Based on a review of steelhead growth studies, Sullivan et al. (2000) found that compared to optimum temperatures, an MWAT of 17.0°C reduced steelhead growth by 10%, and an MWAT of 19.0°C reduced growth by 20%. See InfoLinks for more information. Temperature data comes from automated water temperature data probes placed in the Russian River and its tributaries by the Sonoma County Water Agency (SCWA). | |
 |
To learn more about this topic click Info Links .
To view additional information (data source, aquisition date etc.) about this page, click Metadata .
To view the table with the chart's data, click Chart Table web page.
To download the table with the chart's data, click tempsum_rus_scwa_98_01_gy_dailyavg.db (size 18,432 bytes) .
To view the table with the chart's source data, click Source Table web page.
To download the table with the chart's source data, click temperature_proxy.dbf (size 80 bytes)
| www.krisweb.com |