
|
Area/Topic | Bibliography | Background | Hypotheses | Home |
|
Map Page.
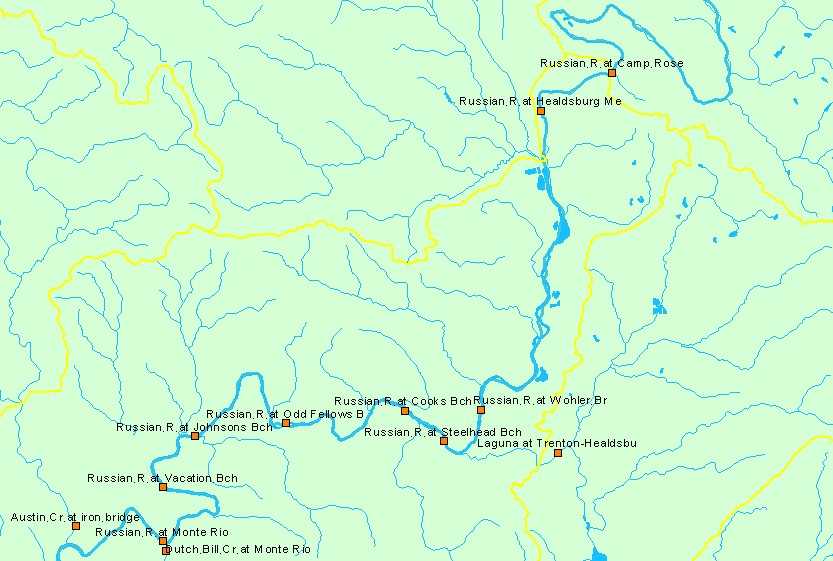
You selected the area Laguna and the topic WQ: 1973-2000 pH in Laguna de Santa Rosa at Trenton Bridge |
| This map shows water quality monitoring stations in the Laguna and Healdsburg areas of Russian River basin, displayed with 1:100,000 scale streams and sub-basins. Data were contributed by North Coast Regional Water Quality Control Board (NCRWQCB). These stations are part of a much larger NCRWQCB dataset, which is included in KRIS as a source table. This GIS layer contains only the sites from that larger dataset that have geographic coordinates. Scale = 1:131,887 . | |||
|
|
||
| www.krisweb.com |