
|
Area/Topic | Bibliography | Background | Hypotheses | Home |
|
Map Page.
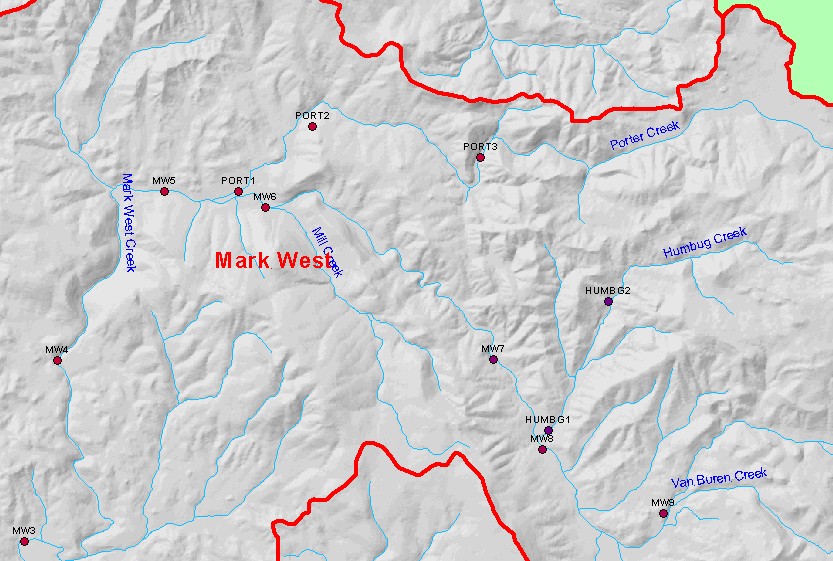
You selected the area Mark West and the topic Temperature: Floating Weekly Avg. at Porter Cr.-Lwr (PORT1), 1999-2001 |
| This map shows temperature monitoring stations in the Porter Creek, displayed with USGS 1:24,000 scale streams, sub-basins, and a grayscale hillshade. Data were contributed by Sonoma County Water Agency. Scale = 1:49,005 . | |||
|
|
||
| www.krisweb.com |