
|
Area/Topic | Bibliography | Background | Hypotheses | Home |
|
Map Page.
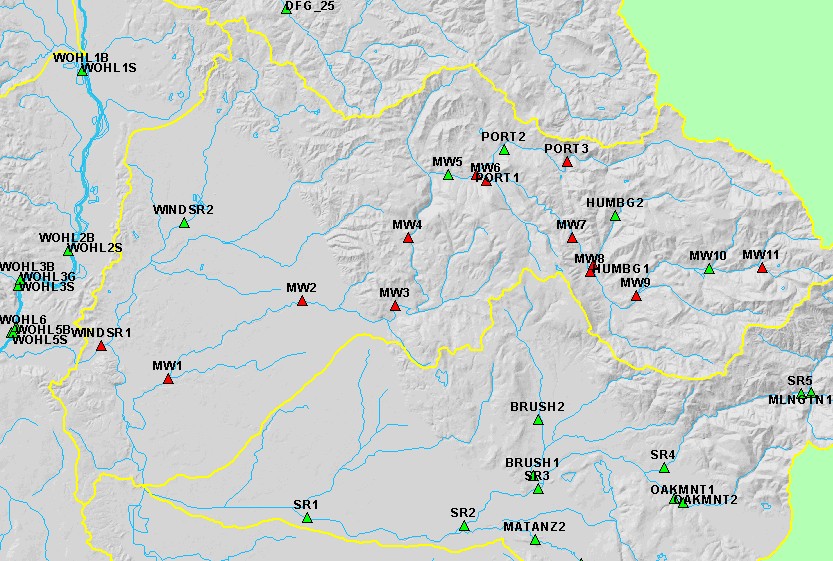
You selected the area Mark West and the topic Map: 2F. Temperature Points Hotlinked to Data Charts |
| This map shows temperature monitoring stations in the Mark West sub-basin, displayed with USGS 1:100,000 scale streams, sub-basins, and a grayscale hillshade. Data were contributed by Sonoma County Water Agency. The red points on the map are hotlinked to KRIS temperature topic charts. To view a chart, click on a red point. Scale = 1:130,171 . | |||
|
|
||
| www.krisweb.com |