
| Area | Ukiah |
| Topic | Flow: EF Russian R nr Ukiah, CA - Monthly Ave - Pre/Post Coyote Dam |
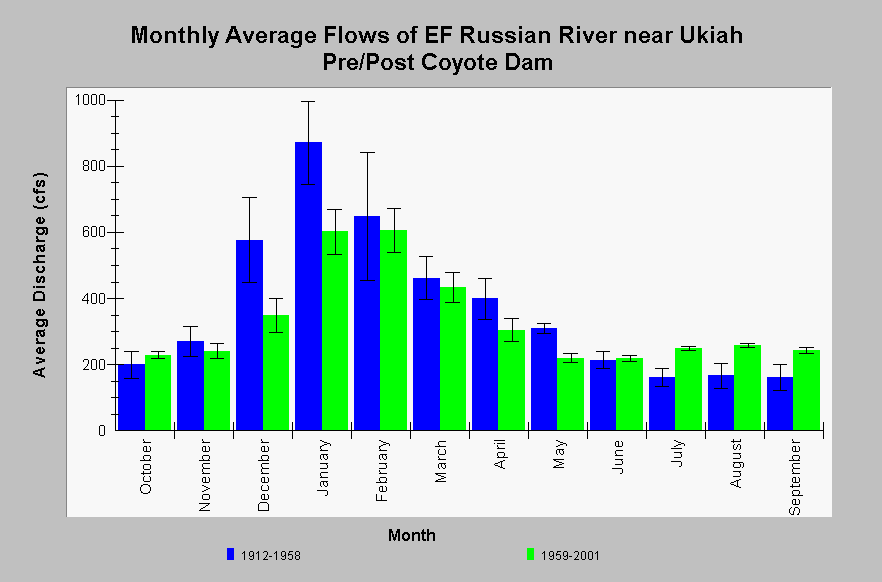
| Caption: This chart compares monthly average discharge (cfs) of the East Fork Russian River near Ukiah, CA (US Geological Survey gauging station #11462000) for the periods pre- and post-completion of Coyote Dam that occurred in 1958. Whiskers bracket one standard error from the mean. In general, high flows occur during winter months in response to storm events and lower summertime base flows occur between June and October. The introduction of Coyote Dam altered the magnitudes of peak winter flows and summertime base flows. Average December, January, and May flow magnitudes have been reduced. Monthly average summer base flows in July through September have increased in magnitude. Monthly flows are compiled by the US Geological Survey. See InfoLinks for more information. | |
 |
To learn more about this topic click Info Links .
To view additional information (data source, aquisition date etc.) about this page, click Metadata .
To view the table with the chart's data, click Chart Table web page.
To download the table with the chart's data, click flow_monthcompar_usgs11462000_efrus_nr_ukiah.dbf (size 1,006 bytes) .
To view the table with the chart's source data, click Source Table web page.
To download the table with the chart's source data, click flow_mon_usgs11462000_efrus_nr_ukiah_1912_2001.dbf (size 28,162 bytes)
| www.krisweb.com |