
| Area | Ukiah |
| Topic | Flow: Russian R nr Hopland, CA - Annual Peaks 1940-2001 |
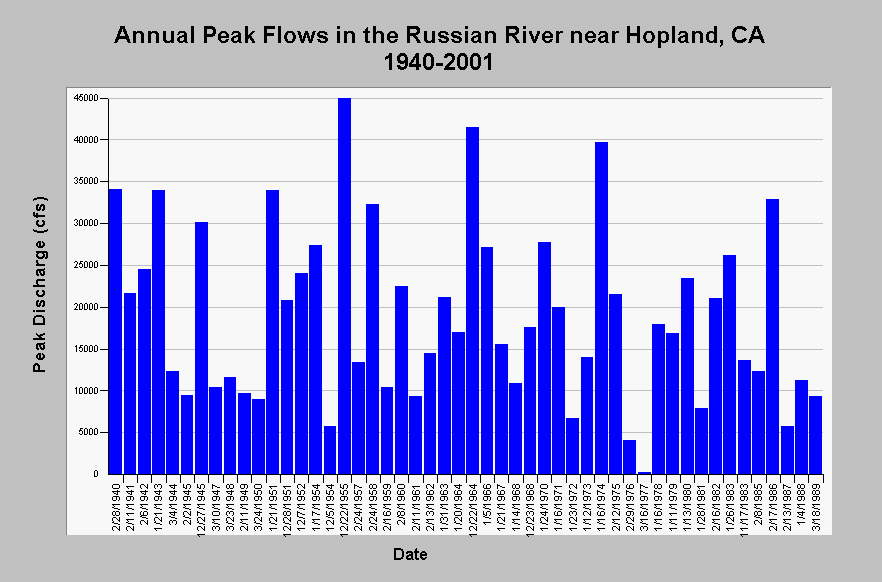
| Caption: This chart displays annual peak discharge in the Russian River near Hopland, CA (US Geological Survey gauging station #11462500) for the water years 1940 through 2001. To some degree, all peak flows shown are influenced by the Potter Valley Project diversion and peak flows during and after 1958 are influenced by the Coyote Dam. The maximum observed peak was 45000 cfs in December 22, 1955 and the minimum only reached 225 cfs in March 16, 1977. See InfoLinks for more Information. | |
 |
To learn more about this topic click Info Links .
To view additional information (data source, aquisition date etc.) about this page, click Metadata .
To view the table with the chart's data, click Chart Table web page.
To download the table with the chart's data, click flow_yrpeak_usgs11462500_rus_1940_2001.dbf (size 2,394 bytes) .
| www.krisweb.com |