
| Area | Ukiah |
| Topic | Temperature: Floating Weekly Avg., Russian River Sites, 2000 |
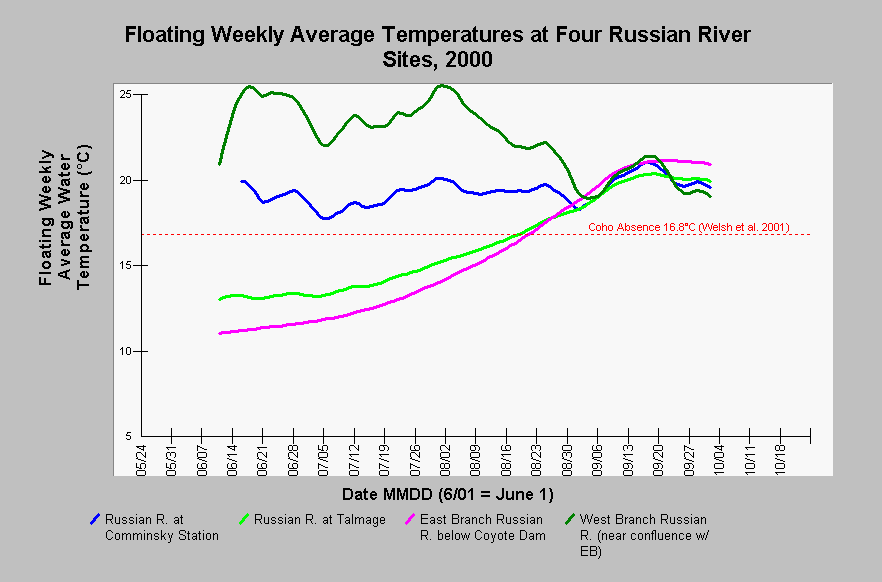
| Caption: This Chart shows the floating weekly average water temperatures at four Russian River sites in the Ukiah Sub-basin for the year 2000. Sites are listed in the legend in upstream order (lowest site is on left side). The uppermost and warmest site shown is the lower West Branch Russian River, where summer flow is intermittent. The copious cool water released from Coyote Dam in June warms 2.0°C in the 7.5 km distance to Talmage. From Talmage to Comminsky, the water warms another 6.0°C in 40 km. Maximum floating weekly average water temperatures (MWAT) far exceeded 16.8°C at all four sites. Welsh et al. (2001) found that coho are not likely to persist where MWAT exceeds 16.8°C. Temperature data comes from automated water temperature data probes placed in the Russian River and its tributaries by Mendocino County Water Agency. | |
 |
To learn more about this topic click Info Links .
To view additional information (data source, aquisition date etc.) about this page, click Metadata .
To view the table with the chart's data, click Chart Table web page.
To download the table with the chart's data, click temp_rus_mcwa_97_01_uk_daily.db (size 202,752 bytes) .
To view the table with the chart's source data, click Source Table web page.
To download the table with the chart's source data, click tempraw_rus_mcwa_97_01.dbf (size 6,270,984 bytes)
| www.krisweb.com |