
| Area | Warm Springs |
| Topic | Flow: Dry Cr nr Geyserville - Annual Peaks 1960-2001 |
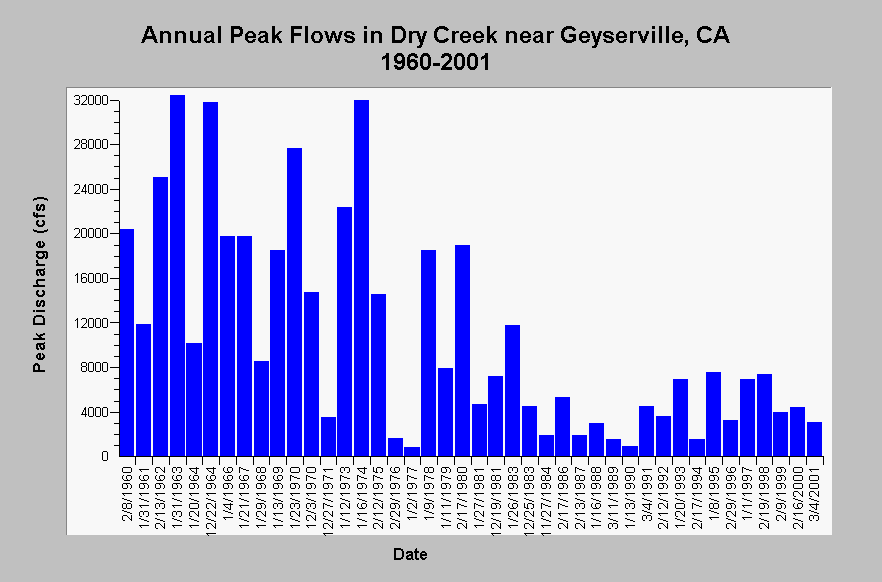
| Caption: This chart displays annual peak discharge in Dry Creek near Geyserville, CA for the water years 1960 through 2001. Warm Springs Dam began filling in 1983, reducing the magnitude of the peak flows observed below the dam. Annual peak flows were measured by the US Geological Survey at gauging station #11465000. See InfoLinks for more Information. | |
 |
To learn more about this topic click Info Links .
To view additional information (data source, aquisition date etc.) about this page, click Metadata .
To view the table with the chart's data, click Chart Table web page.
To download the table with the chart's data, click flow_yrpeak_usgs11465200_drycr_1960_2001.dbf (size 1,674 bytes) .
| www.krisweb.com |