
| Area | Warm Springs |
| Topic | Climate: Rainfall - Warm Springs Dam - Daily Maximum 1959-2000 |
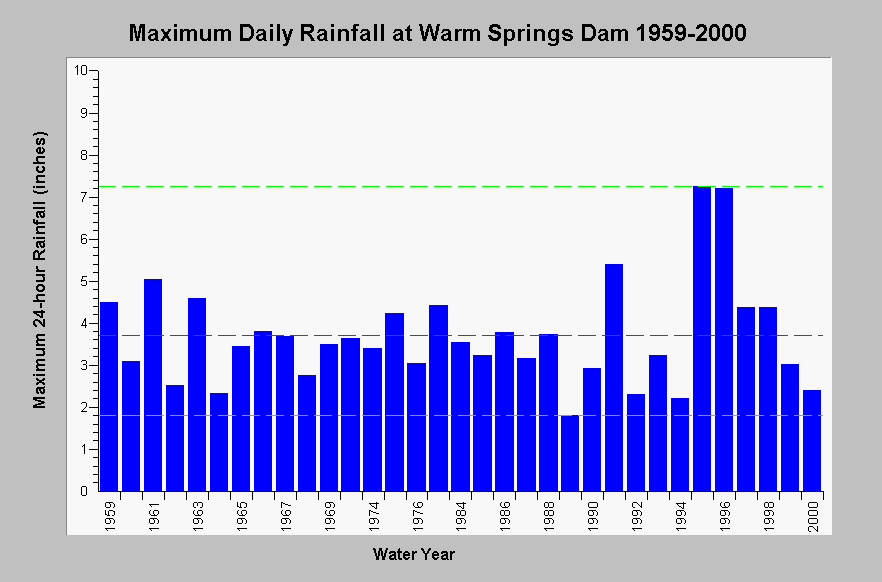
| Caption: This chart shows maximum daily (24-hour) rainfall totals recorded at the Warm Springs Dam rain gage (DWR # F90 9440 00) between 1959 and 2000, missing years 1970-1972 and 1987-1982. The average 24-hour rainfall for the period of record is 3.69 inches (red dashed line). The minimum and maximum daily totals (green dashed lines) are 1.80 inches in 1989 and 7.26 inches in 1995, respectively. See InfoLinks for more information. | |
 |
To learn more about this topic click Info Links .
To view additional information (data source, aquisition date etc.) about this page, click Metadata .
To view the table with the chart's data, click Chart Table web page.
To download the table with the chart's data, click climate_rainfall_annualstats2_warmspringsdam.dbf (size 1,194 bytes) .
| www.krisweb.com |