| Basin |
Sheepscot |
| Caption |
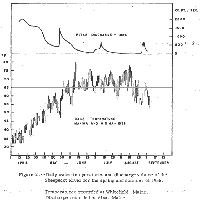
This chart shows the daily minimum and maximum temperatures in the Sheepscot River at Whitefield and streamflow in the Sheepscot at Alna in the summer and fall of 1956. Water temperatures were recorded on a thermograph. The chart was extracted from Bryant (1956) and horizontal gridlines were added. Maximum daily temperatures are noticeable lower in 1956 than they were in 1994, 1995, and 1997. In 1956, maximum temperatures reached 80°F on 1 day, 75°F on 13 days, and 70°F on 44 days. In 1994, the same statistics were 11 days, 46 days, and 69 days, respectively. In 1995, the same statistics were 3 days, 41 days, and 55 days, respectively. In 1997, the same statistics were 0 days, 15 days, and 63 days, respectively. The temperature increase from 1956 to 1994 and 1995 may be due to differences in streamflow because July average streamflow was 32.23 cfs in 1994 and 32.58 cfs in 1995, compared to 78.45 cfs in 1956. The temperature increase between 1956 and 1997 are not completely explainable by differences in streamflow, as July average streamflow was higher in 1997 (82.81 cfs) than it was in 1956 (78.45 cfs), but the number of 70°F and 75°F days was much higher in 1997. |
| CaptionTemplate |
[Description] |
| Category |
Monitoring |
| Description |
This chart shows the daily minimum and maximum temperatures in the Sheepscot River at Whitefield and streamflow in the Sheepscot at Alna in the summer and fall of 1956. Water temperatures were recorded on a thermograph. The chart was extracted from Bryant (1956) and horizontal gridlines were added. Maximum daily temperatures are noticeable lower in 1956 than they were in 1994, 1995, and 1997. In 1956, maximum temperatures reached 80°F on 1 day, 75°F on 13 days, and 70°F on 44 days. In 1994, the same statistics were 11 days, 46 days, and 69 days, respectively. In 1995, the same statistics were 3 days, 41 days, and 55 days, respectively. In 1997, the same statistics were 0 days, 15 days, and 63 days, respectively. The temperature increase from 1956 to 1994 and 1995 may be due to differences in streamflow because July average streamflow was 32.23 cfs in 1994 and 32.58 cfs in 1995, compared to 78.45 cfs in 1956. The temperature increase between 1956 and 1997 are not completely explainable by differences in streamflow, as July average streamflow was higher in 1997 (82.81 cfs) than it was in 1956 (78.45 cfs), but the number of 70°F and 75°F days was much higher in 1997. |
| Filename |
bryant_1956_sheepscot_tempflow.gif |
| Filesize |
44382 |
| Meta_Id |
Bryant_1956 |
| Notefile |
sheepscot.htm#bryant_1956 |
| Path |
ms/bryant_1956_sheepscot_tempflow.gif |
| Series |
Monitoring- Sheepscot at Whitefield Temperature 1956 |
| SubBasin |
Mainstem Sheepscot |

