Photo Pages. Photos on this page are from sub-basin Basinwide / Regional
and series Monitoring- Charts of River Ice Trends in coastal Maine.
Click on any thumbnail to see a larger photo.
For detailed information on these photos click here.
120 KB
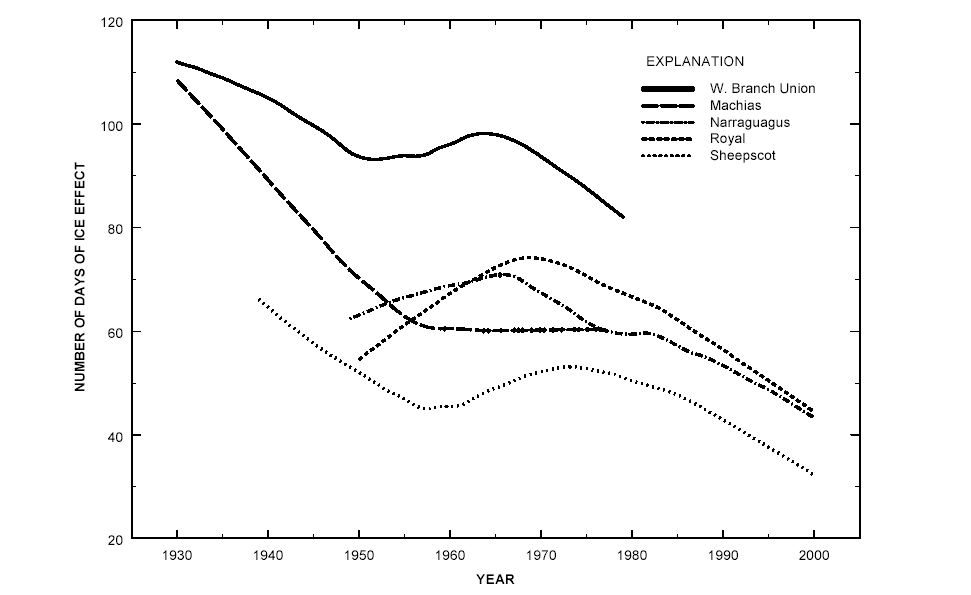
Trends in total number of days of ice effect for coastal rivers in Maine. Loess regression lines are based on a 35-year weighting window. According to Dudley and Hodgkins (2002), the trend toward fewer days of ice effect is statistically significant at all rivers except for the Sheepscot River. This figure is from Dudley and Hodgkins (2002).
118 KB
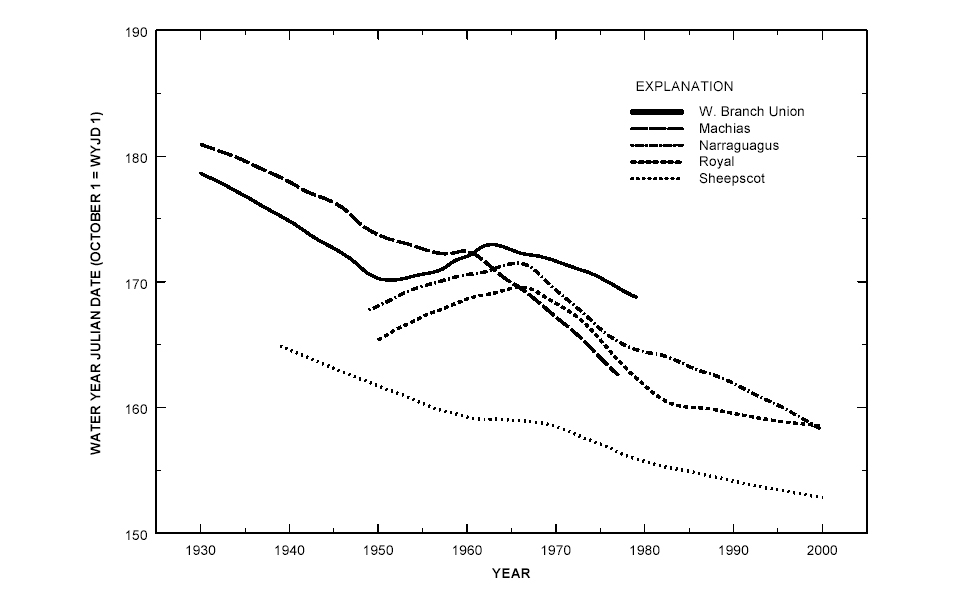
in last ice-off date for coastal rivers in Maine. Loess regression lines are based on a 35-year weighting window. The Sheepscot River (round dotted line) is trending toward earlier last spring ice-off date with a net change in last ice-off date of 12 days within 62 years (1939-2000) of record. Figure is from Dudley and Hodgkins (2002).
117 KB
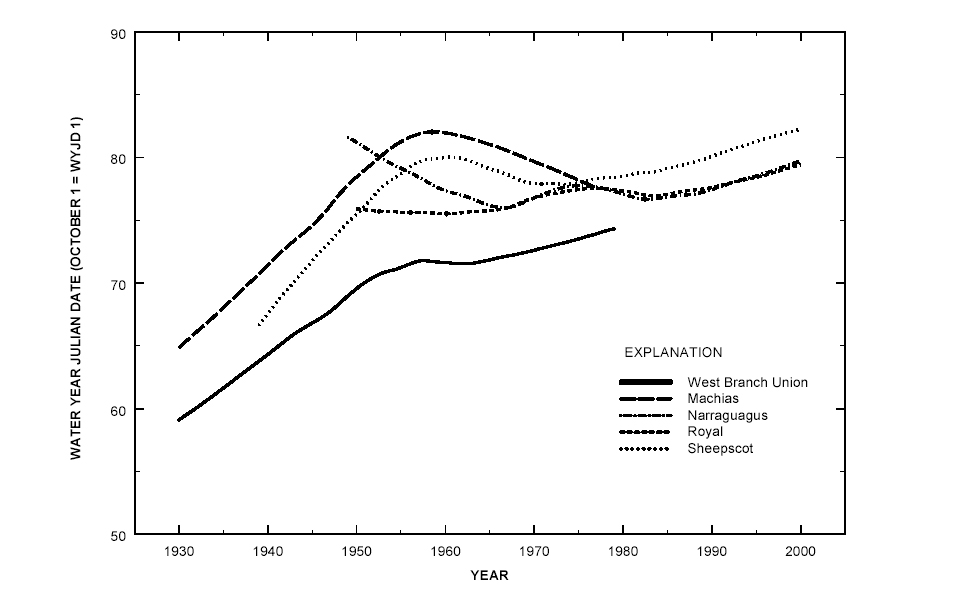
Trends in first ice-on date for coastal rivers in Maine. Loess regression lines are based on a 35-year weighting window. The Sheepscot River (round dotted line) is trending towards a later first fall ice-on date in the recent century. Figure is from Dudley and Hodgkins (2002).
 118 KB
 117 KB