| Area | Basin-wide/Regional |
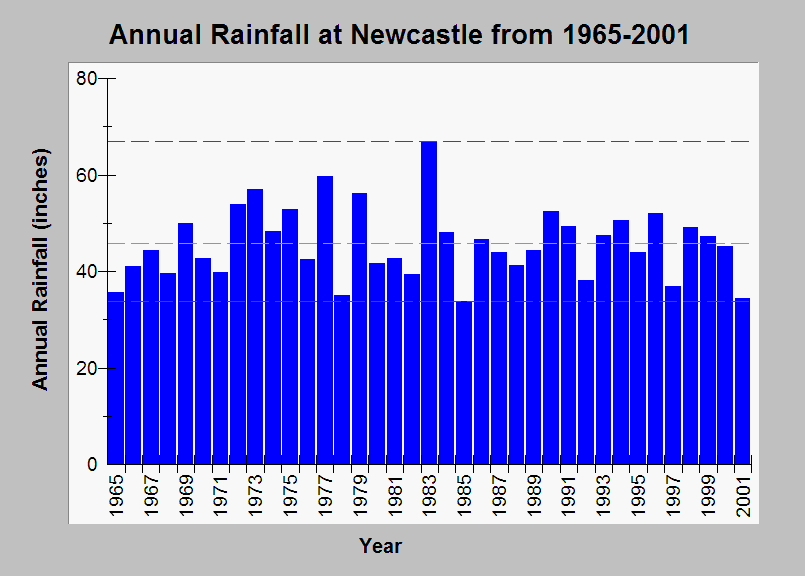
| Topic | Climate: Annual Rainfall Newcastle, 1965-2001 |
| Caption: This chart illustrates the annual total precipitation from 1965 to 2001 at Newcastle, ME. The minimum and maximum rainfalls (shown in red) during this period were in 1983 at 67.0 inches and in 1985 at 33.8 inches, respectively. The average total annual rainfall (shown in green) is 46 inches. The data came from the Maine State Climate Office. See Info Links for more information. The red lines indicate the minimum and maximum total annual rainfalls and the green line is the average total annual rainfall for the period of record. | |
 |
To learn more about this topic click Info Links .
To view additional information (data source, aquisition date etc.) about this page, click Metadata .
To view the table with the chart's data, click Chart Table web page.
To download the table with the chart's data, click climate_annual_rainfall_newcastle_1965_2001.dbf (size 801 bytes)
To download the table with the chart's data as an Excel spreadsheet, click climate_annual_rainfall_newcastle_1965_2001.dbf.xls (size 4,608 bytes) .
| www.krisweb.com |
