
| Area | Basin-wide/Regional |
| Topic | Land Use: Sheepscot Population and Housing Units, 1990-2000 |
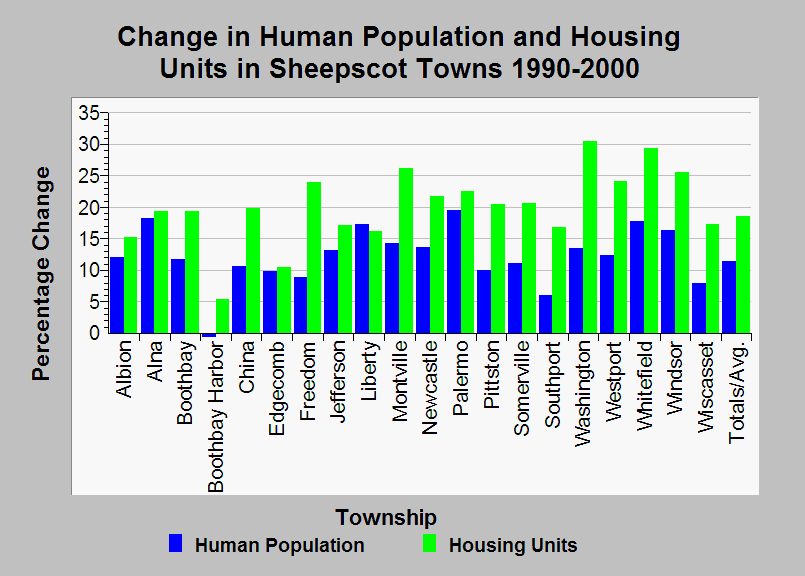
| Caption: This chart shows the change in human population and housing units from 1990 to 2000 in the townships of the Sheepscot River watershed. The total number of housing units in all townships increased by 18.5%, much faster than the 11.4% increase in human population, indicating that sprawl is occurring. Data were contributed by the Maine State Planning Office. See Info Links for more information. | |
 |
To learn more about this topic click Info Links .
To view additional information (data source, aquisition date etc.) about this page, click Metadata .
To view the table with the chart's data, click Chart Table web page.
To download the table with the chart's data, click landuse_sheep_mspo_1990_2000.db (size 18,432 bytes)
To download the table with the chart's data as an Excel spreadsheet, click landuse_sheep_mspo_1990_2000.db.xls (size 10,752 bytes) .
| www.krisweb.com |