
| Area | Basin-wide/Regional |
| Topic | WQ: Sulfate Levels MDEP Baseflow Sites 1999-2001 |
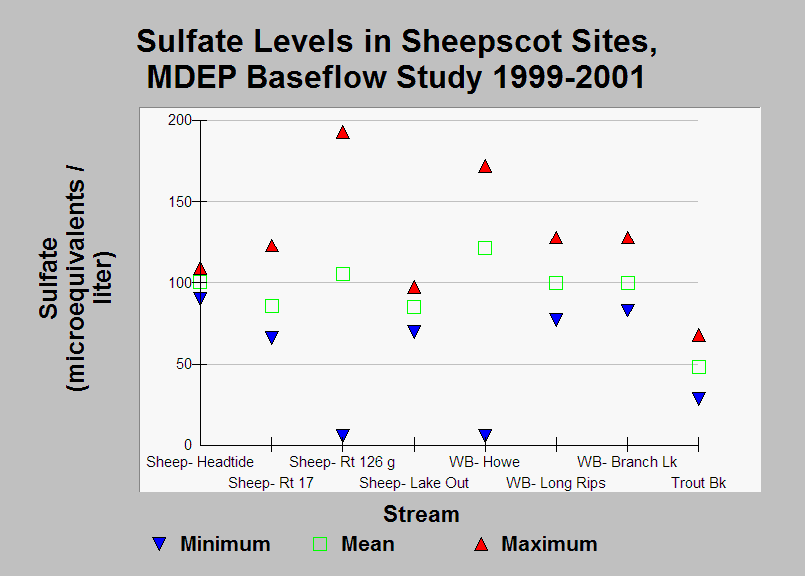
| Caption: This chart shows the minimum, mean, and maximum sulfate levels measured during the Maine Department of Environmental Protection WQM Program's 1999-2001 baseflow study. Data were collected in June-October. Sulfate levels ranged from 5.76- 193 ueq/L in the Sheepscot basin. Levels in Trout Brook (28.5 - 68.0 ueq/L) contained less variability compared to the mainstem and the West Branch. See Info Links for more information. | |
 |
To learn more about this topic click Info Links .
To view additional information (data source, aquisition date etc.) about this page, click Metadata .
To view the table with the chart's data, click Chart Table web page.
To download the table with the chart's data, click wq_base_bw_dep_master_99_01_summary.db (size 22,528 bytes)
To download the table with the chart's data as an Excel spreadsheet, click wq_base_bw_dep_master_99_01_summary.db.xls (size 11,764 bytes) .
| www.krisweb.com |