
| Area | Basin-wide/Regional |
| Topic | WQ: Total Phosphorus in Sheepscot Lakes 1976-2002 |
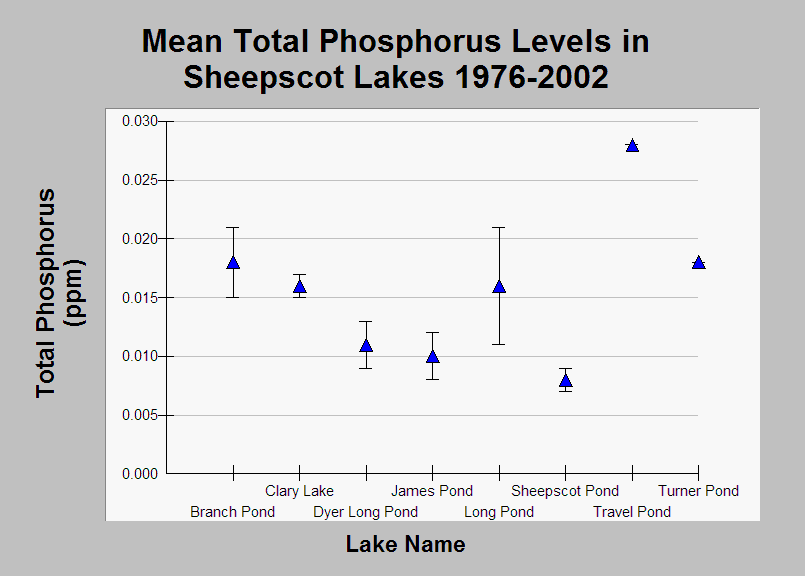
| Caption: This chart shows mean total phosphorus levels in eight Sheepscot lakes for the period of 1976-2002. Mean phosphorus levels range from 0.008 to 0.028 ppm in Sheepscot lakes and are highest in Travel Pond. The error bars show the standard error. Phosphorous is a major nutrient that limits pant and algae growth in lakes. These data were collected as discrete samples through the Maine Volunteer Lake Monitoring Program and in some cases only one sample was collected per year and sampling often happened between July and September. See individual sub-basin topics for the annual trends in lake phosphorus levels. See Info Links for more information. | |
 |
To learn more about this topic click Info Links .
To view additional information (data source, aquisition date etc.) about this page, click Metadata .
To view the table with the chart's data, click Chart Table web page.
To download the table with the chart's data, click wq_bw_lakes_pearl_tp_76-02.xls_ave.db (size 4,096 bytes)
To download the table with the chart's data as an Excel spreadsheet, click wq_bw_lakes_pearl_tp_76-02.xls_ave.db.xls (size 4,096 bytes) .
| www.krisweb.com |