

|
|
|
| Background | Hypotheses | Bibliography | Maps | Home |
KRIS Web Backgrond Pages: Temperature
![]()
Inexpensive automated temperature sensing probes have revolutionized the collection of water temperature data making it possible to collect hourly data for months with a limited number of site visits. The advent of these devices allowed Georgia Pacific (now Hawthorne Timber Company) fish biologists to monitor dozens of sites in the Ten Mile River Basin. The large amount of regional temperature information is a powerful tool for analyzing salmonid stream conditions. The Forest Science Project ( Lewis, 1999) has provided protocols for data collection..
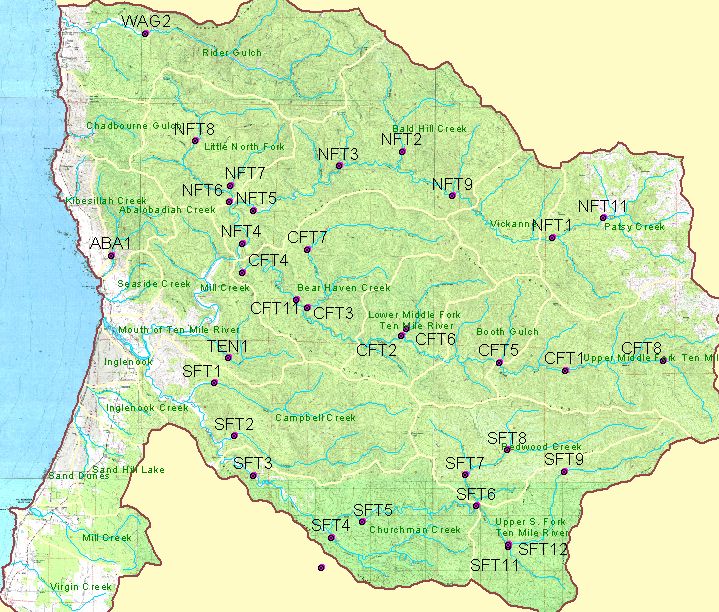
The Hawthorne Timber Company (HTC), formerly Georgia Pacific, has collected water temperature data since 1993 at 23 locations throughout the Ten Mile River basin (see Map), although not every location has been measured every year. HTC staff gave temperature data to the Institute for Fisheries Resources (IFR) staff for use in KRIS. Most temperature data sets in KRIS have been previously trimmed, to remove outliers, such as temperatures recorded before and after the device is placed in the water. Hourly data were assimilated into large tables with location columns using the KRIS Hobo Import program . Then the KRIS Build Table functions were used to make tables of floating weekly average temperature for all locations. This allows comparisons across locations and at a single location over several years.
The primary type of temperature chart used for analysis in KRIS Ten Mile compares floating weekly average temperatures. The floating weekly average charts use a reference a value of 16.80 C as an indication that streams with water temperatures exceeding this value are not likely to have coho. Welsh et al. (2001) referenced the maximum floating weekly average temperatures as MWAT and found that when it exceeded 16.80 C in streams of the Mattole basin, coho salmon were absent. The use of MWAT in KRIS Ten Mile follows this convention and is not to be confused with MWAT as defined by Armor (1990). Welsh et al. (2001) and Hines and Ambrose (in review) both found that when the floating weekly maximum temperature exceeded 18.30 C coho were absent from regional streams. Results of temperature analysis are also presented in Ambrose et al. (1997) and Ambrose and Hines (1998).
The following examples show the various types of temperature charts in KRIS Ten Mile. Data provided by Hawthorne Timber Company.
|
The floating weekly average water temperature at Mill Creek is shown at left. Mill Creek is a small tributary near the coast. The temperature did not exceed 16.8 degrees in the six years measured, which means that temperature would not be limiting to coho salmon. |
|
This chart shows floating weekly average temperature of the North Fork Ten Mile River (Site NFT11) near its headwaters, immediately below natural grasslands. The lack of coniferous forests, which is largely driven by geology, makes the North Fork much more subject to warming. The floating weekly average water temperature exceeded 16.8 degrees in all three years measured. |
|
This chart shows floating weekly average temperatures in 1997 for five sites located on the South Fork Ten Mile River. The legend lists sites in sequence from upstream to downstream, showing that the South Fork warmed 2.0-2.5 degrees Celsius flowing from Gulch 11 to just downstream at Redwood Creek. The stream cooled slightly in the more coastal segment between Churchman and Smith creeks, but still exceeded the stress threshold for coho salmon. See Hypothesis 5 to learn more about potential causal mechanisms for stream warming. |
|
Maximum floating weekly average temperature (MWAT) is charted at left for each site in the North Fork Ten Mile sub basin for available data in the years 1993-2001. Sites begin with the confluence with the Middle Fork (NFT15) and are listed in order along the mainstem North Fork to the most headwaters site (NFT11). Sites following to the right are tributary locations. The mainstem North Fork (1,3,4,5,9,11,15) exceeds suitable temperatures for coho in many years, while tributaries (2,6,7,8,10) are generally cooler. |
|
This chart shows maximum floating weekly average temperature (MWAT) for each site in the Middle Fork Ten Mile sub basin for available data in the years 1993-2001. Sites begin near the confluence with the North Fork (CFT4) and are listed in order along the mainstem Middle Fork to the most headwaters site (CFT8). Sites following to the right are tributary locations. Lower mainstem Middle Fork reaches have temperatures too warm for coho in some years, while tributaries are generally suitable. |
|
This chart shows maximum floating weekly average temperature (MWAT) for each site in the South Fork Ten Mile sub basin for available data in the years 1993-2001. Sites begin in the lowest South Fork (SFT3) and are listed in order along the mainstem South Fork to the most headwaters site (SFT9). Sites following to the right are tributary locations. The South Fork follows a similar pattern to the North and Middle Forks with mainstem temperatures too warm for coho but tributaries sufficiently cool to support them. |
|
The floating weekly maximum water temperature at Lower Middle Fork Ten Mile River Site CFT4 did not exceed 18.3 degrees C in 2001. The 18.3 degree C stress reference value for coho salmon was chosen based on Hines and Ambrose (in review) and indicates that this site would have been suitable for coho in 2001. Floating weekly maximum (FWM) charts were constructed for 2001 data only. |
|
Daily minimum, maximum, and average water charts were also constructed for 2001 data only. The chart at left shows that at lower Redwood Creek (site SFT7) maximum daily temperatures exceeded the range preferred by salmonids during most of the 2001 season. The daily range of temperature (minimum versus maximum) exceeded 3.0 degrees C for the entire month of July. Such daily temperature variation may represent a riparian canopy that is not functional in maintaining a microclimate. |
Two Hypotheses (#3 and #5) in KRIS Ten Mile are concerned with temperature analysis.
![]()
References
Ambrose, J., D. Hines, D. Hines, D. Lundby, and J. Drew. 1996. Ten Mile River Watershed 1995 Instream Monitoring Results. Volume I. Georgia-Pacific West Inc. Fort Bragg, CA. 84 pp.
Ambrose, J., and D. Hines. 1997. Ten Mile River Watershed 1996 Instream Monitoring Results. Georgia-Pacific West Inc. Fort Bragg, CA. 55 pp.
Ambrose, J., and D. Hines. 1998. Ten Mile River Watershed 1997 Instream Monitoring Results. Georgia-Pacific West Inc. dba The Timber Company. Fort Bragg, CA. 51 pp.
Brett, J.R. 1952. Temperature tolerance in young Pacific salmon, genus Oncorhynchus. J. Fish. Res. Board of Canada. 9(6):265-323. http://www.humboldt.edu/~fsp/tim/1952article.html
Hines, D. and J. Ambrose. In review. Evaluation of stream temperatures based on observations of juvenile coho salmon in northern California streams. Draft submitted to North American Journal of Fisheries Management. 30 pp.
Lewis, T. 1999 . Regional Stream Temperature Monitoring Protocol. Forest Science Project, Humboldt State University. Arcata, CA. 29 pp.
McCullough, D. 1999 . A Review and Synthesis of Effects of Alterations to the Water Temperature Regime on Freshwater Life Stages of Salmonids, with Special Reference to Chinook Salmon. Columbia Intertribal Fisheries Commission, Portland, OR. Prepared for the U.S. Environmental Protection Agency Region 10. Published as EPA 910-R-99-010.
Welsh, Hartwell, PhD. Personal Communication, USDA Forest Service, Redwood Science Lab, Arcata, CA.
Welsh,
H.H., Jr., G.R. Hodgson, B.C. Harvey, and M.F. Roche. 2001. Distribution
of juvenile coho salmon in relation to water temperatures in tributaries of
the Mattole River, California. North American Journal of Fisheries Management
21(3):464-470. [335k] .
![]()
| www.krisweb.com |