
| Area | Basin-wide |
| Topic | Climate: Rainfall - Manzanita Lake - Annual Totals 1950-2000 |
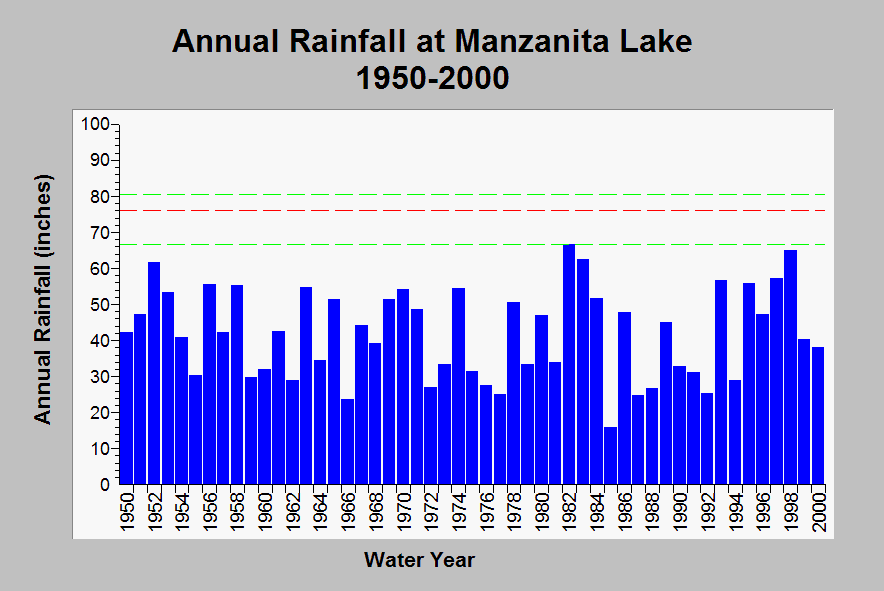
| Caption: This chart shows annual rainfall accumulation recorded at the Manzanita Lake rain gage (DWR # A40 5311 00) between 1950 and 2000. Rainfall measurements are by water year (Oct 1-Sept 30). The average annual rainfall is approximately 42 inches (red dashed line). For the period of record, the minimum total rainfall accumulation occurred in 1985 with 15.94 inches shown as the lower dashed green line and the maximum during 1982 was 66.60 inches (upper green line). Data were provided by the California Department of Water Resources. See Info Links for more information. | |
 |
To learn more about this topic click Info Links .
To view additional information (data source, aquisition date etc.) about this page, click Metadata .
To view the table with the chart's data, click Chart Table web page.
To download the table with the chart's data, click climate_rainfall_annual_stats_manzanita.dbf (size 1,558 bytes)
To download the table with the chart's data as an Excel spreadsheet, click climate_rainfall_annual_stats_manzanita.dbf.xls (size 6,144 bytes) .
| www.krisweb.com |