
| Area | Basin-wide |
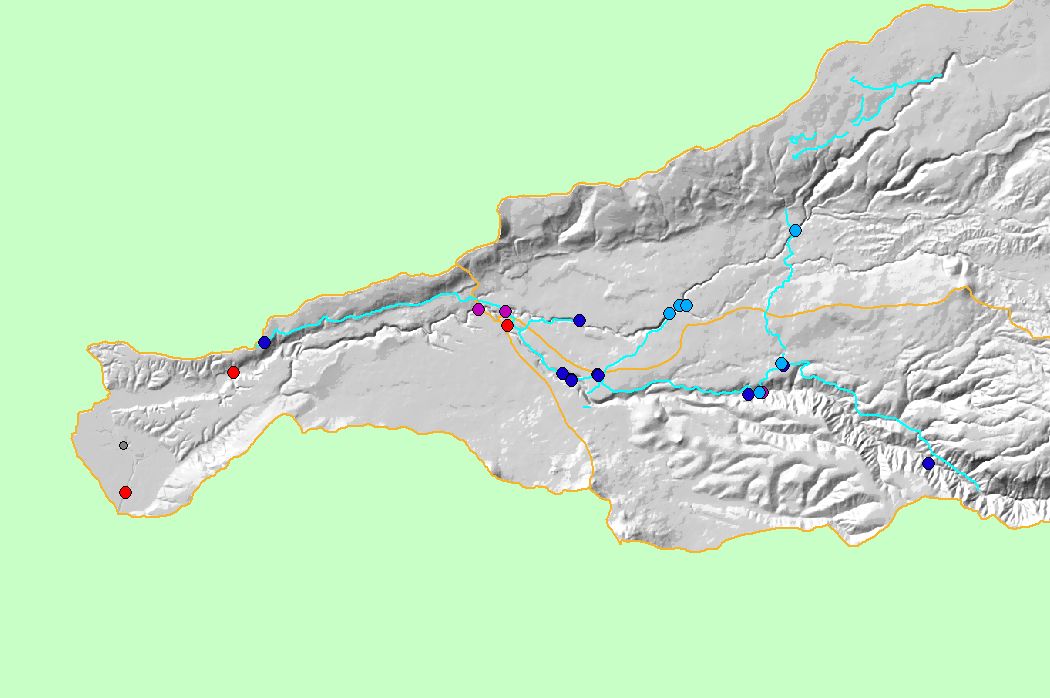
| Topic | Temperature: MWAT at Battle Sites, by Year 1998-2001 |
| This map shows locations of temperature monitoring stations in Battle Creek and its tributaries, overlayed on top of USGS 100,000 scale streams (including canals), KRIS sub-basins, and a grayscale hillshade. Sites are color-coded by their maximum floating weekly average temperature (MWAT) for the year 2001. Data were contributed by the California Department of Water Resources. Scale = 1:181,885 . | |||
 |
 |
||
To view metadata about a map layer, click on a link in the table below.
| Name of Layer in Map Legend | Metadata File Name |
|---|---|
| Temperature Monitoring - MWAT 2001 | battle_temps.shp.txt |
| Artificial Waterways | canals.shp.txt |
| Sub-basins (no labels) | subbasins.shp.txt |
| Grayscale Hillshade | grayscale_light.tif.txt |
| Project Area | battl_outl.shp.txt |
| www.krisweb.com |