Area/Topic | Bibliography | Background | Hypotheses | Home |
KRIS Battle Creek: Map Page
Area | Basin-wide |
Topic | Vegetation: USFS/CDF Landsat Change Scene Detection 1991-1999 |
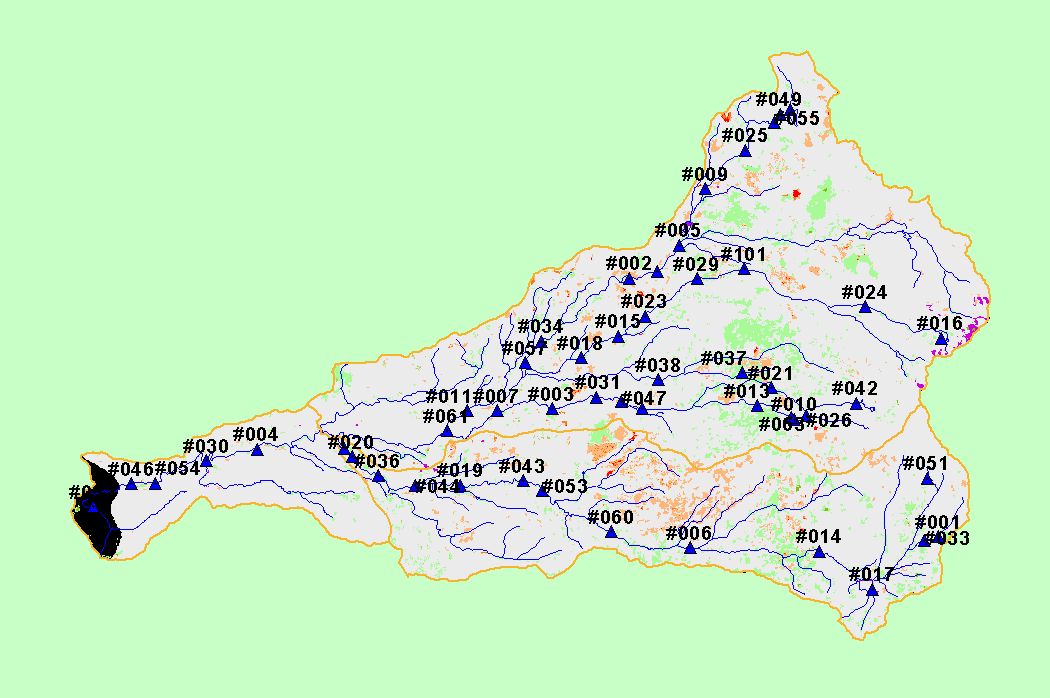
This is a map of change in vegetation in the North Fork Battle sub-basin for the periods 1991-1996 and 1994-1999, displayed with KRIS sub-basins, 1:100,000 scale streams, and the locations sampled as part of the Battle Creek Watershed Assessment (Terraqua, 2004). Vegetation change were calculated based on Landsat satellite images. Canopy loss (red and orange) represent vegetation decreases due to recent recent disturbance such as timber harvesting or fire. Green on the map represents an increase in canopy, indicating regrowth from previous timber harvesting or fire. Data were provided by the U.S. Forest Service Pacific Southwest Region Remote Sensing Lab, in cooperation with the California Department of Forestry. | |||
![]() |
![]() |
To view metadata about a map layer, click on a link in the table below.Name of Layer in Map Legend Metadata File Name Watershed Analysis Sample Sites (labels) samplesites.shp.txt Watershed Analysis Sample Sites samplesites.shp.txt Sub-basins (no labels) subbasins.shp.txt Sub-basins (no labels) subbasins.shp.txt Project Frame mask1.shp.txt Streams (1:100k scale)(no labels) stms100.shp.txt Change in Veget. (1991-1996)(TIFF) vegchg1.tif.txt Change in Veget. (1994-1999)(TIFF) vegchg2.tif.txt Project Background battl_outl.shp.txt
www.krisweb.com