| Area | Mainstem Battle |
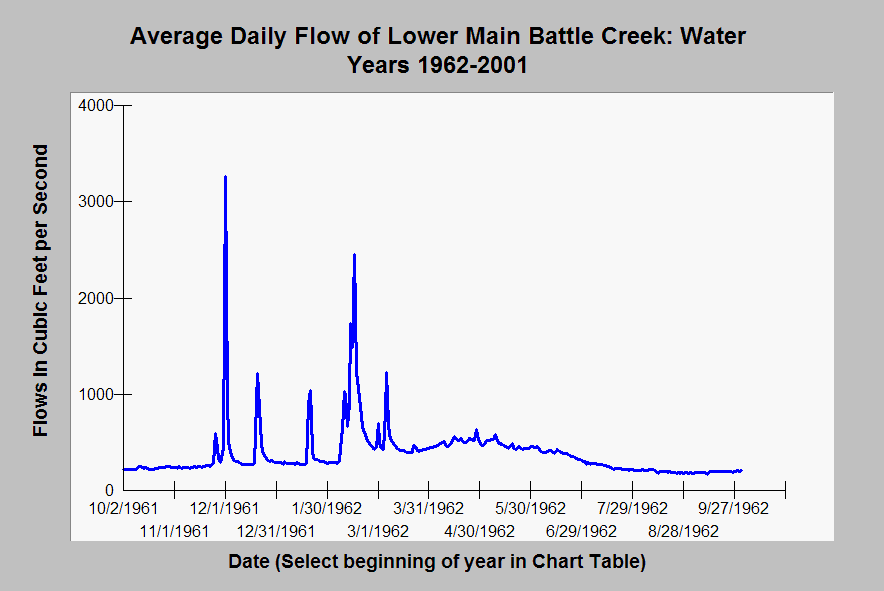
| Topic | Flow: Average Daily Flow Battle Cr below Coleman Hatchery - 1962-2001 |
| Caption: This chart displays average daily flows in cubic feet per second for Battle Creek from 1962 to 2001 as recorded by a USGS stream gauge (#11376550). Early 1997 flow records are missing (Jan-April 1997). The display period is set, by default, for the first water year on record (1961). KRIS database must be installed on your hard drive to review different flow years. On your desk top, you may call up any water year in the record by selecting one in the Chart Table (see instructions there) or using the slide bar under the Y-Column selector. The Y axis of the graph may vary depending on the magnitude of the flows in any given year. | |
 |
To learn more about this topic click Info Links .
To view additional information (data source, aquisition date etc.) about this page, click Metadata .
To view the table with the chart's data, click Chart Table web page.
To download the table with the chart's data, click flow_battle_usgs11376550_1961_2001.dbf (size 261,080 bytes)
To download the table with the chart's data as an Excel spreadsheet, click flow_battle_usgs11376550_1961_2001.dbf.xls (size 529,184 bytes) .
| www.krisweb.com |
