
| Area | North Fork Battle |
| Topic | Climate: Rainfall - Volta Power House - Daily Maximum 1948-2000 |
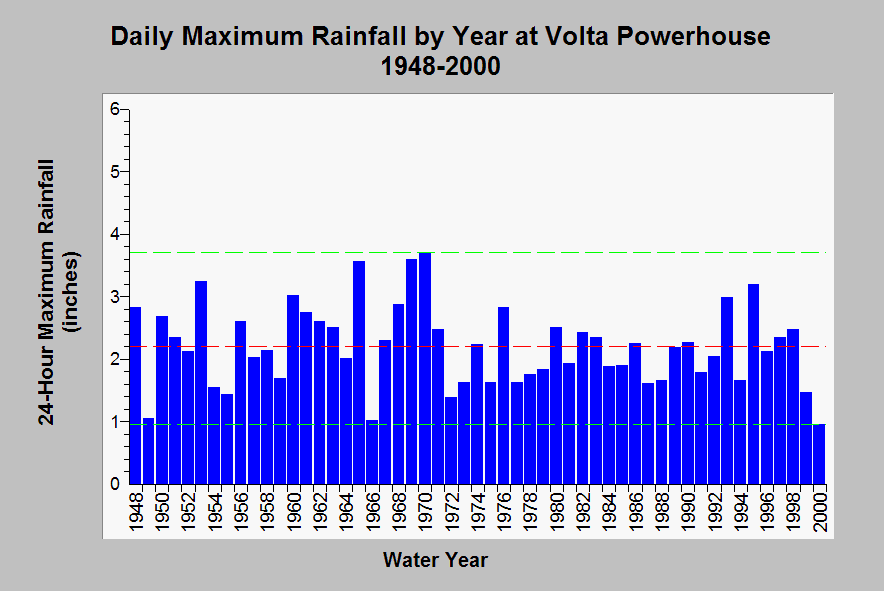
| Caption: This chart shows daily maximum rainfall accumulation recorded at the Volta Power House rain gage (DWR # A40 9390 00) between water years 1948 and 2000. For the period of record, the 24-hour rainfall accumulation ranged between 0.95 inches in 2000 to 3.70 inches in 1970. Minimum and maximum are shown in green dashed lines while the mean of maximum daily rainfall is in red. Data are compiled by the California Department of Water Resources. See Info Links for more information. | |
 |
To learn more about this topic click Info Links .
To view additional information (data source, aquisition date etc.) about this page, click Metadata .
To view the table with the chart's data, click Chart Table web page.
To download the table with the chart's data, click climate_rainfall_annual_stats_volta_1974_2000.dbf (size 1,614 bytes)
To download the table with the chart's data as an Excel spreadsheet, click climate_rainfall_annual_stats_volta_1974_2000.dbf.xls (size 6,144 bytes) .
| www.krisweb.com |