
| Area | North Fork Battle |
| Topic | Sediment: Median Particle Size (D50) at Main Digger Cr Battle WA Sites |
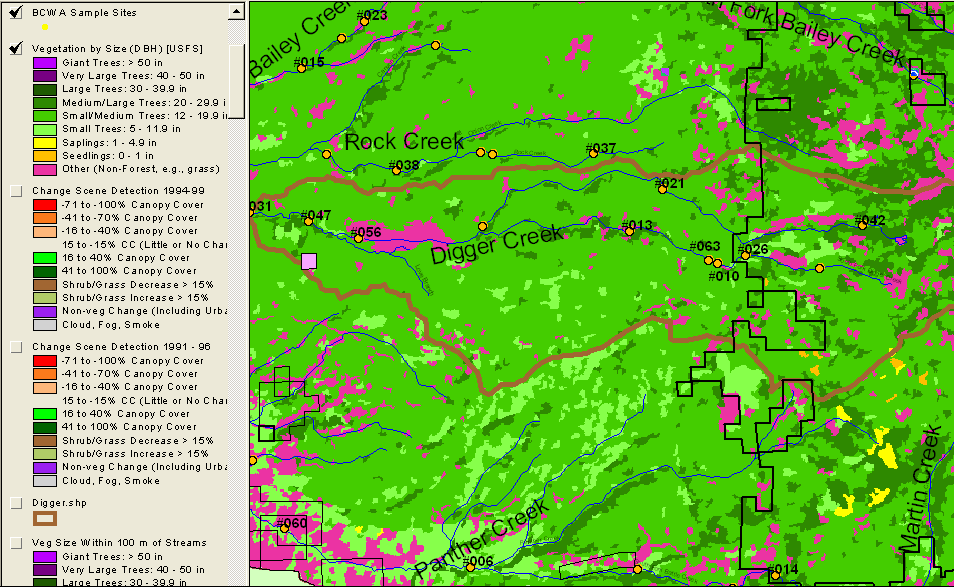
This map image shows Basin #31 of the Battle Creek Watershed Assessment outlined in brown with tree sizes and vegetation types shown according to USFS Landsat derived data. Also shown are other BCWA sites, USGS 1:100 K streams and ownership boundaries with National Forest to the east (right) and private timberland to the west. Smaller trees indicate recent silvicultural activity, which can effect stream flows (Montgomery and Buffington, 1993). See Info Links for more information.
Change scene detection shows information contrasting both 1991 and 1996 Landsat scenes and 1994 and 1999, according to USFS and CDF data. The extensive green areas show growth indicating timber harvest likely taking place within 10-15 years prior to 1991, while orange and red areas show decreased vegetation associated with logging. As areas revegetate, they regenerate filter capacity and normal hydraulic characteristics. See Info Links for more information.
The rain-on-snow zone recognized by Terraqua (2004) of 3500-5000 feet is displayed above with roads and road-stream crossings in BCWA Basin #031. Road densities calculated in this basin were 4.2 miles per square mile of watershed area not including skid trails, temporary roads and landings. High road densities in the rain-on-snow zone are recognized as being linked to increased peak discharges (Jones and Grant, 1996). See Info Links for more information.
This map shows a USGS ortho photo with an overlay of USFS and CDF change scene detection, roads, road stream crossings and BCWA monitoring sites. The black vertical line is the boundary between Lassen National Forest to the east (right) and private industrial timber land to the west. Elevated cumulative effects risk is clear as a result of high road densities and active timber harvest on private lands, which would be consistent with increased peak flows and increased particle size distribution. See Info Links for more information.
This zoom in on the USFS and private land boundary in upper Digger Creek shows both the North Fork and the South Fork and differences in management. White dots on western landscape (at left) are landings. Roads, skid trails, temporary roads and landings may all combine to increase peak discharge. Gucinski et al. (2001) found that roads extended stream networks that lead to this result. See Info Links for more information.
 Click on image to enlarge (67K).
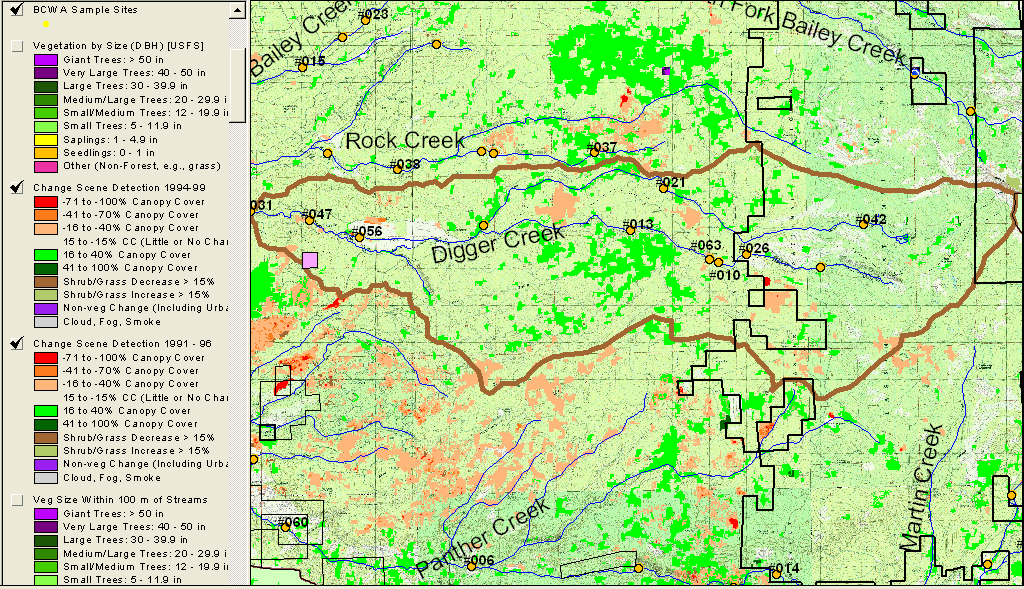 Click on image to enlarge (291K).
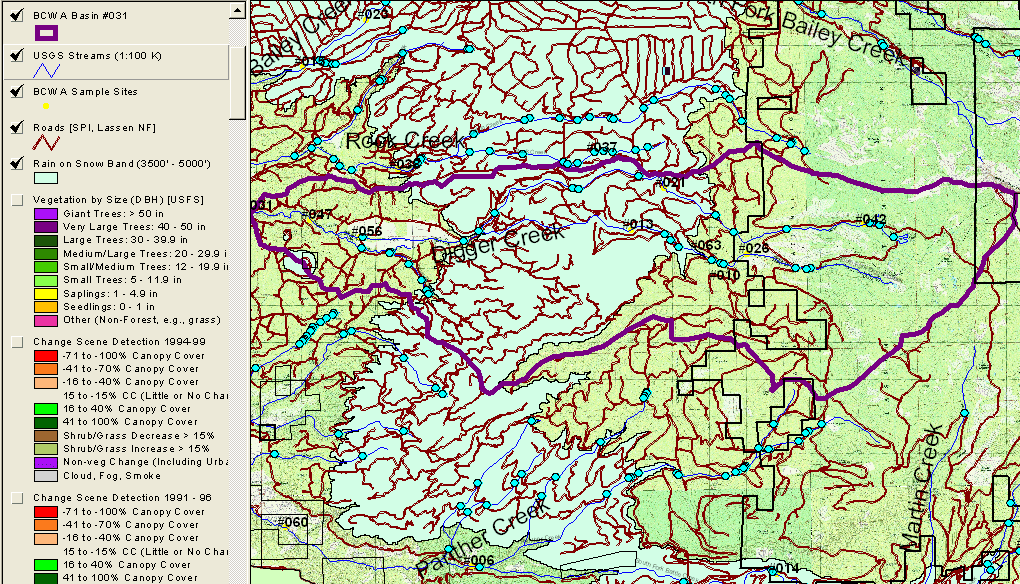 Click on image to enlarge (222K).
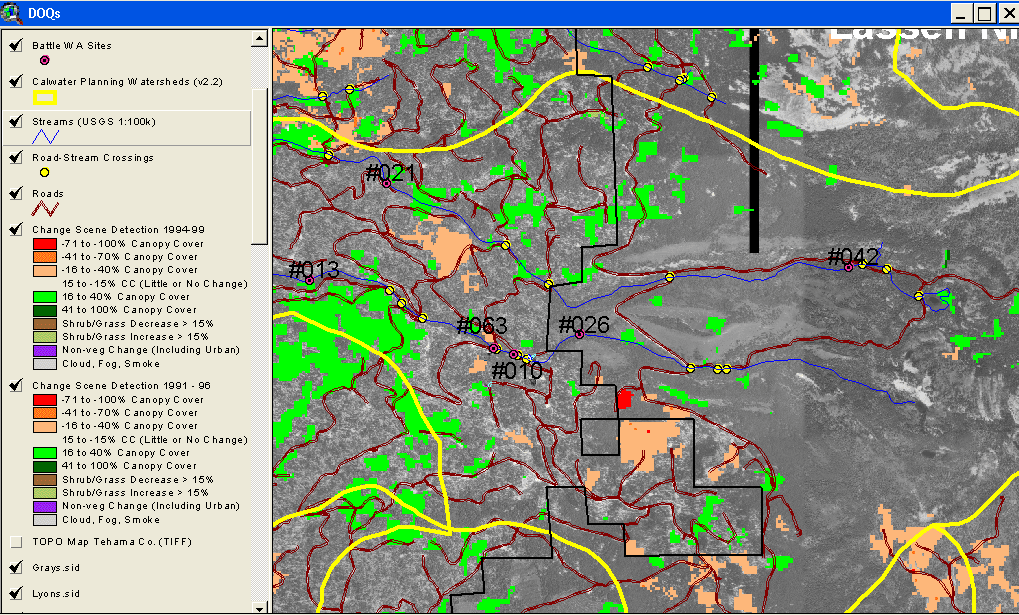 Click on image to enlarge (270K).
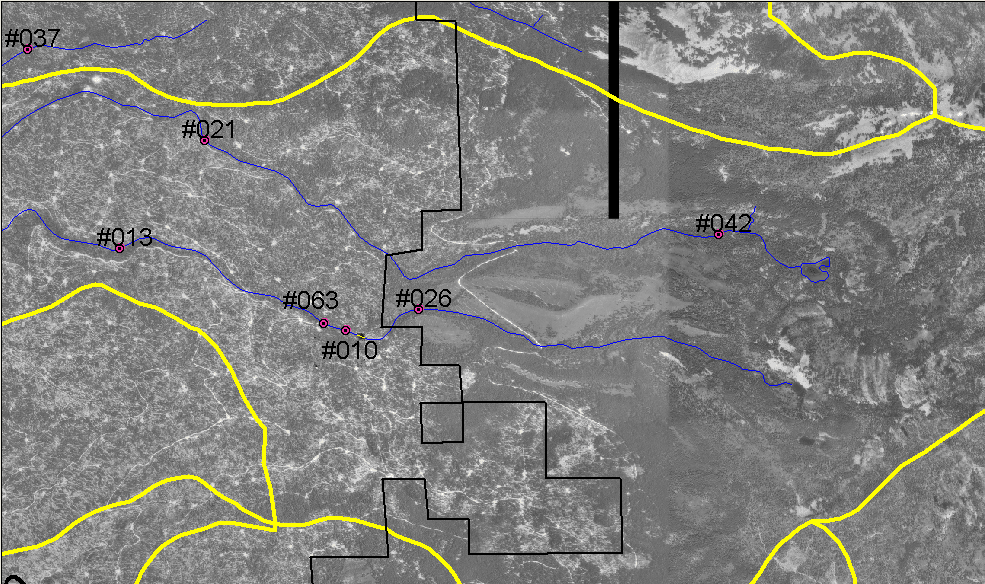 Click on image to enlarge (437K).
To learn more about this topic click Info Links
To view additional information (data source, aquisition date etc.) about this page, click Metadata
| www.krisweb.com |