
| Area | Sacramento R. |
| Topic | Fish: Fall Chinook Sacramento Total Escapement 1952-2003 |
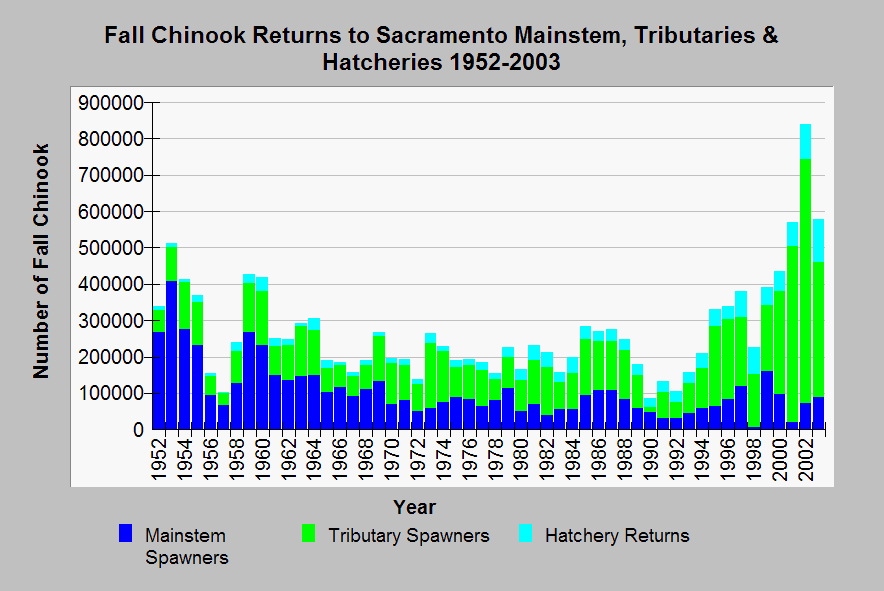
| Caption: This Chart shows the estimate of numbers of fall chinook salmon returning to the mainstem Sacramento River, its tributaries and hatcheries from 1952-2003. The highest return over-all was in 2002 when 839,956 fall chinook returned, while the low point in returns came in 1990 when only an estimated 86,478 fall chinook returned to the entire Sacramento River drainage. Note that the hatchery component has increased in recent years and that mainstem spawners have diminished in comparison to tributary and hatchery spawners. Hatcheries are on tributaries and excess hatchery fish are likely contributing to tributary "natural" spawning totals. Results for 2000-2003 are provisional and subject to revision. Data from the California Department of Fish and Game. | |
 |
To learn more about this topic click Info Links .
To view additional information (data source, aquisition date etc.) about this page, click Metadata .
To view the table with the chart's data, click Chart Table web page.
To download the table with the chart's data, click sac_escapement_h_w_1952_2003.dbf (size 3,002 bytes)
To download the table with the chart's data as an Excel spreadsheet, click sac_escapement_h_w_1952_2003.dbf.xls (size 10,752 bytes) .
| www.krisweb.com |