| Area | South Fork Battle |
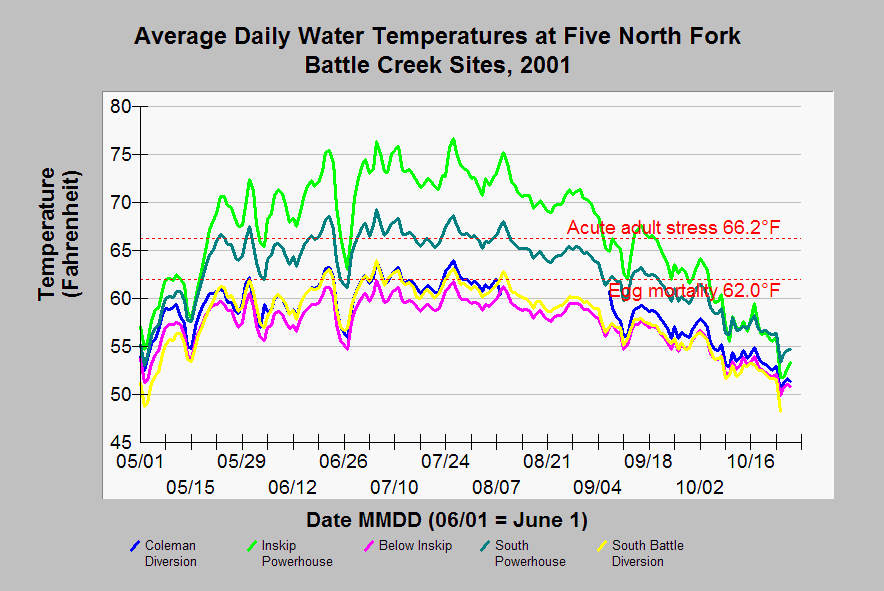
| Topic | Temperature: Average at 5 South Fork Sites, 2001 |
| Caption: This Chart shows average daily water temperatures at five North Fork Battle Creek sites for the year 2001, listed in the legend in upstream order. Data from the probe at the convergence of the North Fork was eliminated because it was out of the range of norm for both location (versus other locations) and for the same location in previous years. Reference values follow conventions of the Battle Creek Watershed Restoration Plan (Ward and Kier, 1999). See Info Links for more information. | |
 |
To learn more about this topic click Info Links .
To view additional information (data source, aquisition date etc.) about this page, click Metadata .
To view the table with the chart's data, click Chart Table web page.
To download the table with the chart's data, click temp_bat_dwr_sf_98_01_daily.db (size 565,248 bytes)
To download the table with the chart's data as an Excel spreadsheet, click temp_bat_dwr_sf_98_01_daily.db.xls (size 365,851 bytes) .
| www.krisweb.com |
