
| Area | South Fork Battle |
| Topic | Temperature: Min, Ave, Max Above Convergence w/ NF, 1998 |
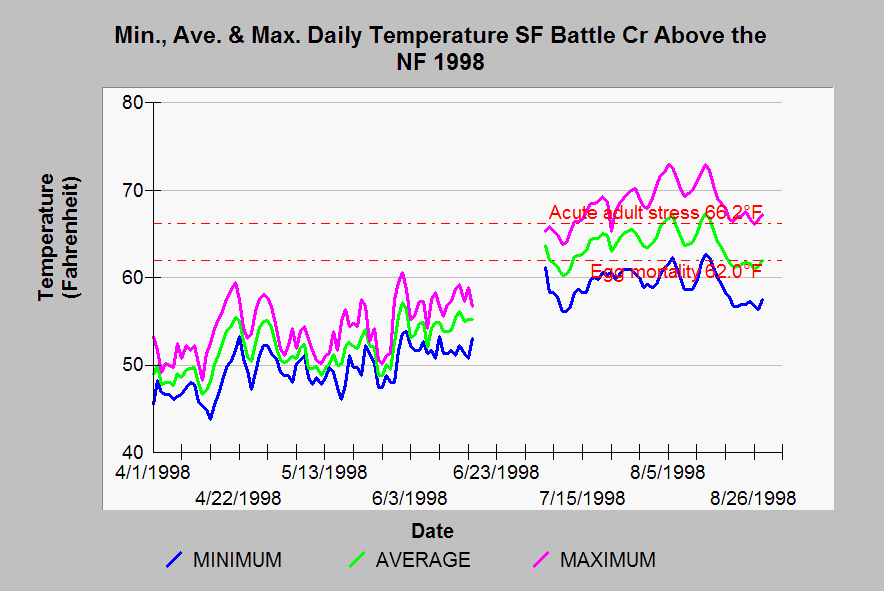
| Caption: This temperature graph shows minimum, maximum, and average water temperatures of the lowest reach of South Fork Battle Creek above its convergence with the North Fork in 1998. Reference values follow conventions of the Battle Creek Watershed Restoration Plan (Ward and Kier, 1999). See Info Links for more information on temperature thresholds. There is no data for the period 6/19/98 to 7/4/98. | |
 |
To learn more about this topic click Info Links .
To view additional information (data source, aquisition date etc.) about this page, click Metadata .
To view the table with the chart's data, click Chart Table web page.
To download the table with the chart's data, click sfmma98.dbf (size 10,995 bytes)
To download the table with the chart's data as an Excel spreadsheet, click sfmma98.dbf.xls (size 13,562 bytes) .
| www.krisweb.com |