
| Area | South Fork Battle |
| Topic | Temperature: Min, Ave, Max Above Inskip PH, 1996 |
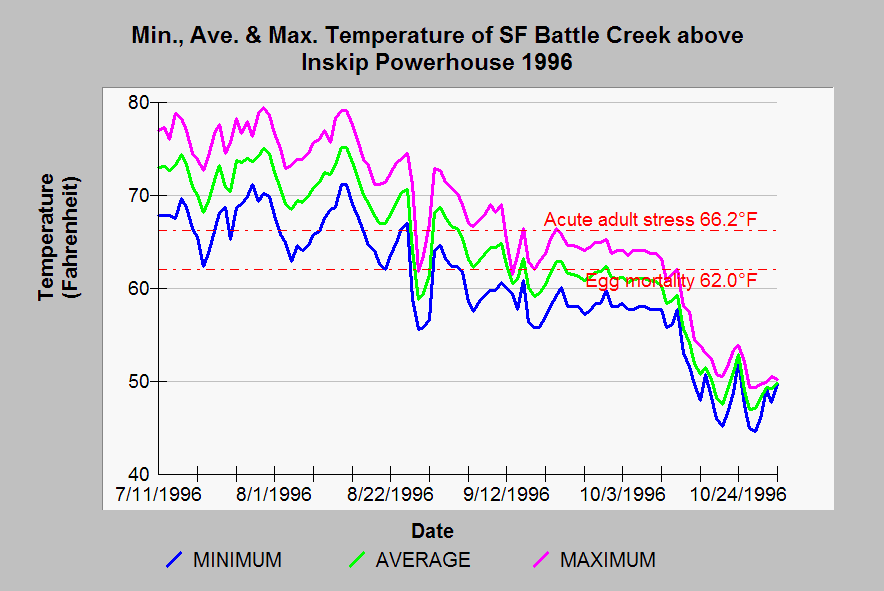
| Caption: This temperature graph shows minimum, maximum, and average water temperatures on South Fork Battle Creek above Inskip Powerhouse in 1996. Thresholds shown on the graph above are for the egg life history stage before July 1 for winter chinook, spring chinook eggs after September 15 and for holding spring chinook adults during summer (July-September). Temperatures were far too high in 1996 for holding adult spring-run chinook salmon (June through mid-September) and even exceeded lethal levels for spring chinook eggs after September 15. High water temperatures are in part owing to low flows related to diversion for power. Although this reach is known to be below optimal elevations for both winter run and spring run chinook, temperature suitability might improve somewhat with increased flows in this reach associated with restoration (click Picture tab). See Info Links for more information on temperature thresholds. | |
 |
To learn more about this topic click Info Links .
To view additional information (data source, aquisition date etc.) about this page, click Metadata .
To view the table with the chart's data, click Chart Table web page.
To download the table with the chart's data, click sf3mma96.dbf (size 8,028 bytes)
To download the table with the chart's data as an Excel spreadsheet, click sf3mma96.dbf.xls (size 11,312 bytes) .
| www.krisweb.com |